How to Draw Supply & Demand Zones
In this blog post, I’ll walk you through how to draw supply and demand zones using pin bars as your reference candlesticks. A pin bar is a type of price bar, usually a candlestick, that indicates a sharp price reversal and rejection. Often called a pin bar reversal, it’s characterized by a long tail, also known as the shadow or wick. The area between the open and close prices of a pin bar is called the real body. Typically, pin bars have relatively small real bodies compared to their long tails. Here’s an illustration to help you visualize a pin bar:

This is an example of a bullish pin bar. When it forms as a basing candle within a demand zone, you simply draw the proximal line at the upper shadow and the distal line at the lower shadow to define the demand zone. Take a look at the following example:

As shown, by drawing a proximal line and a distal line, we establish a potential demand zone. If the pin bar doesn’t have a nose, you can draw the proximal line at the candle’s close price. Let’s look at a real chart example to see how to draw a demand zone using a pin bar as the basing candle:

In the chart above, you can observe a strong move initiated by a bank or another financial institution—such a move is beyond the capabilities of retail traders, indicating the presence of a significant market player. As price action traders, we focus on recognizing that a financial institution made this move, making the zone very attractive. When the price revisits this zone, the market is likely to move upward. To draw this zone, focus on the basing candle, which in this case is a bullish pin bar. Draw the proximal line at the upper shadow and the distal line at the lower shadow to create an accurate demand zone. As the chart illustrates, when the market retested the zone, it was rejected, and buyers pushed the price higher. Here’s another example:

This is a daily chart of EUR/JPY. Notice the clear Drop-Base-Rally Demand Zone—the basing candle is the last candle formed before the strong upward move. When you identify the basing candle, draw the proximal line at the upper shadow of the pin bar (or at the close of the candle if there’s no nose) and the distal line at the lower shadow to define the demand zone. By drawing these lines, you create a well-defined demand zone. Here’s another example on the AUD/JPY H1 chart:

This chart presents a clear demand zone, making it unnecessary to differentiate between a Drop-Base-Rally and a Rally-Base-Rally pattern. These terms are simply tools to help identify zones. When you see patterns like this, with a strong upward move indicated by large blue candles, it’s evident that a bank is behind the move. Focus on the last candle formed before the strong upward move—in this case, a bullish pin bar as the basing candle. Draw the proximal line at the nose of the candle and the distal line at the lower shadow. Notice how the market moved up again after retracing to test the demand zone, as expected. Here’s another example:

This is a daily chart of USD/CAD, showing a drop-base-rally pattern. The bullish pin bar that formed the basing candle was the last candle before the rally. To draw the zone, simply place the proximal line at the nose and the distal line at the lower shadow. As you can see, drawing demand zones using pin bars as basing candles is straightforward. Now, let’s move on to the next part of this lesson: drawing supply zones using the pin bar pattern, focusing on bearish pin bars as basing candles.

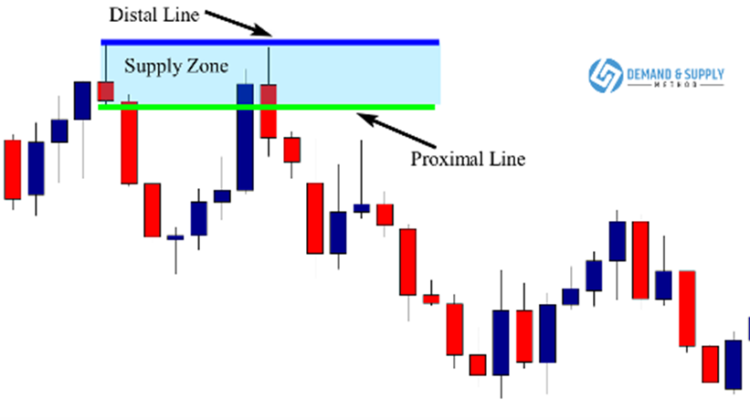
Here’s a bearish pin bar. When it forms as a basing candle in a supply zone, draw the distal line at the upper shadow and the proximal line at the lower shadow. Observe the example below:

In the chart above, a strong down move was identified, triggered by economic news. However, as price action traders, we’re not concerned with the news itself. What matters is that a major player made this move, and when the market tests the zone, there’s a high probability that it will decline. The bearish pin bar served as the basing candle, and as explained earlier, you should draw the distal line at the upper shadow’s end and the proximal line at the lower shadow’s end to create a correct supply zone. The chart shows that when the price tested the supply zone, the market dropped sharply because there were many sell limit orders placed in that zone. Let’s examine another example:

This is the USD/JPY H1 chart. The market formed a nice supply zone, with the last candle before the strong downward move being a pin bar. To define the supply zone, draw the proximal line at the candle’s lower shadow and the distal line at the upper shadow (nose). Notice how the market moved down as expected after retracing to test the supply zone. Let’s look at another example on the GBP/USD H4 chart:

This chart shows another supply zone formed during a downtrend. Once you identify the zone, focus on the last candle before the strong downward move. If it’s a bearish pin bar pattern, draw the proximal line at the lower shadow and the distal line at the upper shadow, just as we’ve done before. Here’s our final example, on the AUD/USD H4 chart:

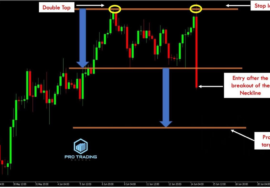
In this example, the market formed a rally-base-drop supply zone. For chart pattern traders, this chart shows a double top continuation pattern. However, the key difference between you as a supply and demand trader and a chart pattern trader is timing. You won’t wait for the double top pattern’s neckline to break or for a pullback after the breakout to enter a trade. Knowing that this is a supply zone, you’ll be in the market before the chart pattern traders. All you need to do is draw the proximal line at the pin bar’s nose and the distal line at the upper shadow. So, when the price retraces to test the zone and forms the double top pattern, you can confidently enter the market without waiting for a neckline breakout.
Now, here’s your homework: open your charts and try to find supply and demand zones where pin bars serve as basing candles. This exercise will help you easily identify and draw the zones when the basing candle is a pin bar.

