Supply and Demand Trading Tactics
In this blog post, I’ll guide you on how to identify supply and demand zones and trade them effectively.
To locate supply and demand zones in the market, simply examine your charts and look for successive large candles.
Let me demonstrate with the EUR/CAD H4 chart below:
Supply-and-Demand Trading
Looking at the chart, you’ll notice a significant down move driven by sellers.
Here’s the key point: when analyzing a chart and you see such a move, pause and examine the beginning of the move, the size of the candles, and their strength.
Clearly, this isn’t an ordinary move; retail traders alone can’t drive the market like this.
This suggests that a bank or financial institution likely initiated the move.
It’s crucial for us to assess the strength of the zone.
As you can see, the move starts quickly and with strength, indicating that the market didn’t linger in the zone.
This suggests that a financial institution placed the order, as the swiftness of the move implies considerable power behind it.
The move is very strong, evidenced by the large red candles, which indicate that a bank with substantial trading volume was likely behind this price action.
Notice that the zone is fresh, meaning it’s being tested for the first time. This makes the area more significant, as key price zones are more likely to break when they’ve been tested multiple times.
So, we’re looking at a supply zone. Don’t worry if you’re still struggling to identify zones; with time and practice, spotting supply and demand zones at first glance will become easier.
Now, let’s draw the supply zone. Refer back to the chart below:

How to Draw Supply Zones
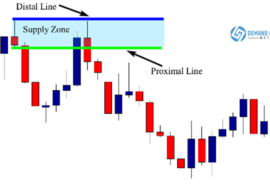
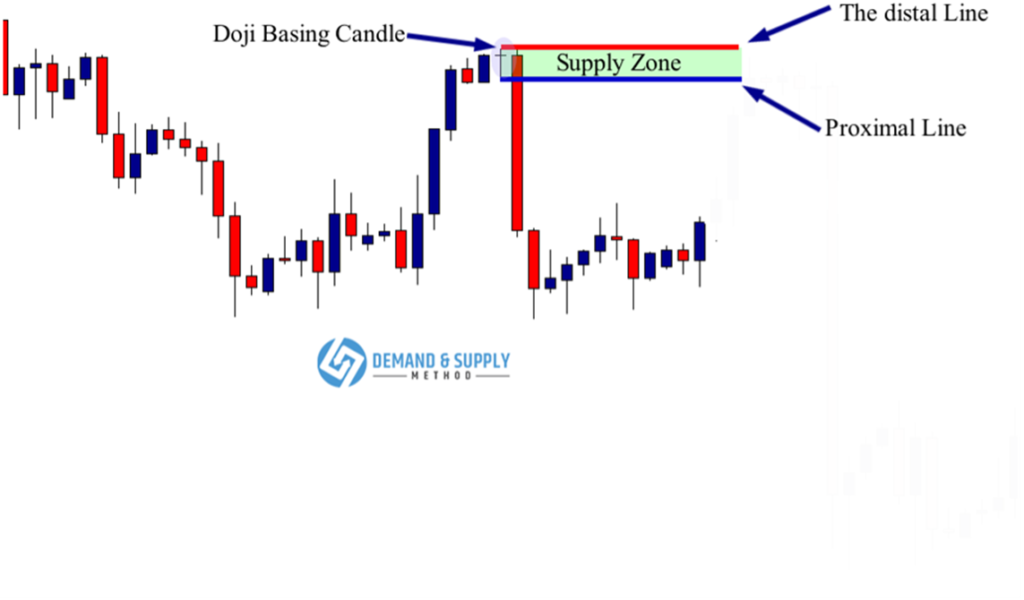
To draw a supply zone, first, identify the basing candle. In this example, the basing candle is a Doji.
Draw the distal line at the top of the upper shadow and the proximal line at the bottom of the lower shadow. This will give you a well-defined supply zone.
Now that we’ve established the supply zone, let’s assess the reward/risk ratio to determine whether the zone is worth trading.
Look at the chart below:

How to Evaluate the Risk-to-Reward Ratio
As you can see, the reward/risk ratio is appealing. If you’re unsure how to calculate the reward/risk ratio, here’s a simple formula:
- Risk = Entry Value – Stop Loss Value
- Reward = Profit Target – Entry Value
In the chart example above, I’ve highlighted the risk and reward in different colors so you can easily gauge what the trade potentially offers.
The trade offers an approximately 1:7 reward/risk ratio. This means that if the market moves in your favor, you could potentially earn seven times the amount you risked.
Trades like this shouldn’t be missed because they don’t appear every day; when they do, you should seize the opportunity.
Let’s say you win this trade; it would boost your confidence, allowing you to trade without fear or stress, knowing that you would need to lose eight consecutive trades to start losing money.
This scenario is highly unlikely if you use supply and demand strategies correctly.
This is why I recommend considering the reward/risk ratio before making any trade; it’s what will ultimately make a difference in your trading account.
Next, we need to conduct a top-down analysis to determine whether the price action on a higher timeframe supports our trade.
Since we’re trading on the H4 timeframe, the appropriate higher timeframe for our analysis is the weekly chart.
Let’s see what’s happening on the weekly chart below:

The Top-Down Analysis
As you can see from the weekly chart above, the market is ranging, and a false breakout occurred at the resistance level, suggesting that the market is likely to decline.
However, before reaching the support level that forms the lower boundary of the range, there’s another support level that might prevent the market from dropping to the lower end of the range.
We can’t be certain what will happen next, but we know there was manipulation at the resistance, indicating the market will likely move down to test one of the support levels.
To stay on the safe side, we should trade between the false breakout and the upper support level on the H4 timeframe.
To be honest, I would take the trade even if the weekly timeframe doesn’t align with the H4 timeframe because the trade setup has all the odds in its favor.
We perform a top-down analysis to get a broader perspective and see if there are any details that could either confirm our entry or signal caution.
In this example, the false breakout at the resistance level suggests the market will at least test the upper support level, confirming our trading idea on the H4 timeframe.
We can go short on the H4 timeframe if we identify a candlestick pattern that signals a reversal.
Now, we have all the information we need: a strong supply zone with a favorable reward/risk ratio and a false breakout at the resistance level on the weekly chart that supports our decision.
All that’s left is to wait for a reversal candlestick pattern at the supply zone to signal our sell order.
Check out the chart below to see what happens next:

How to Trade Supply Zones
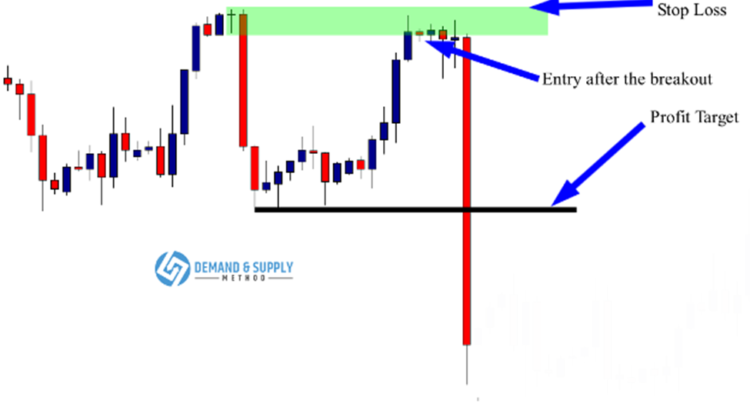
As you can see from the H4 chart above, the market reached the supply zone and formed a nice inside bar candlestick pattern.
We place our trade once there’s a downward breakout of the inside bar. Our stop loss is placed above the upper end of the supply zone, and our profit target is set at the next support level.
See the chart below:

Trading Supply Zones in the Market
As you can see, we placed our trade after the breakout of the inside bar, with the stop loss above the supply zone and the profit target at the next support level.
Notice what happened after the inside bar formation: another bullish pin bar appeared, suggesting that the supply zone might be broken and could fail.
Imagine you placed a trade and kept watching it unfold; how would you feel when you saw that bullish pin bar formation? You’d probably feel anxious, fearing that the zone might fail, leading you to move your stop loss or close the trade.
But look at what happened next! A big candle formed following an economic news release, driving the market down.
If you had let your emotions get the better of you, you would have missed the opportunity to profit significantly from this trade.
This is why you should adopt the “set and forget” approach. This way, you won’t let the market play on your nerves; you’ll set the trade and forget about it. When you return, you’ll likely find that the trade went in your favor, earning you money without fear or stress.

