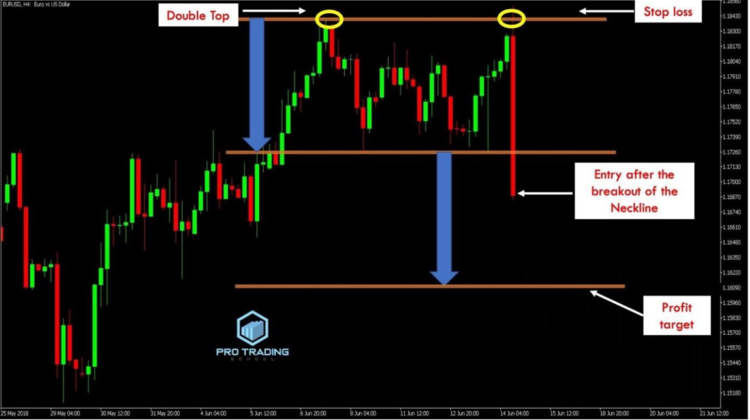
The Double Top Chart Pattern
The double top is a bearish reversal chart pattern commonly observed in bar charts, line charts, and candlestick charts.
As the name suggests, the pattern is characterized by two consecutive peaks at approximately the same level, separated by a moderate trough.
Here’s a visual representation:
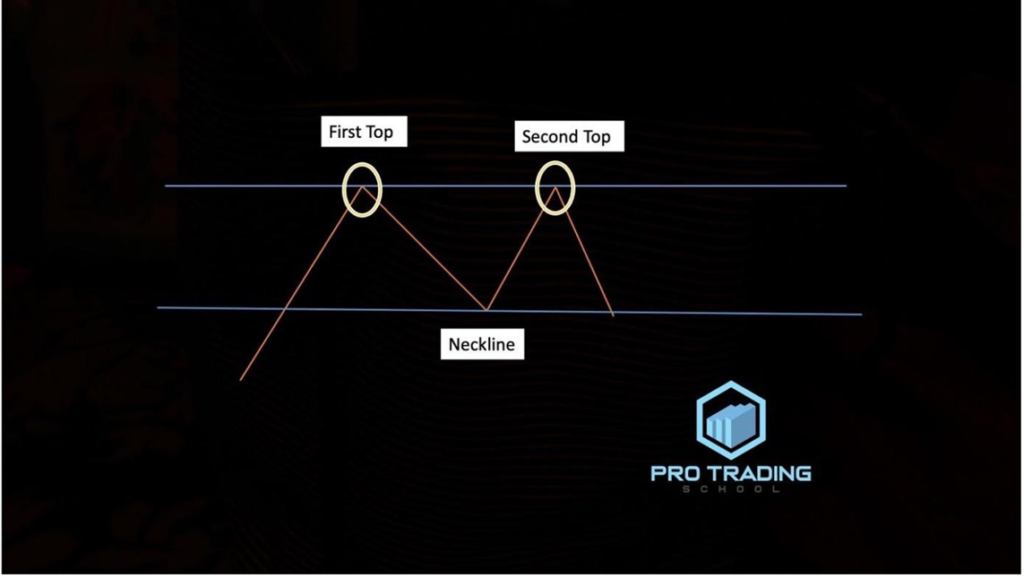
In this illustration, you can see how the price action forms two swing highs, both reaching a significant resistance level.
The fact that the market failed to break through this resistance twice suggests that the level is likely to hold.
How to Recognize a Double Top Pattern
For a double top pattern to be considered valid, it should meet these criteria:
- An existing uptrend or a significant upward move.
- The first peak establishes a resistance level.
- The second peak is also rejected at this resistance level.
- The price subsequently breaks below the neckline, a key support level.
To better illustrate, let’s look at a real chart example:
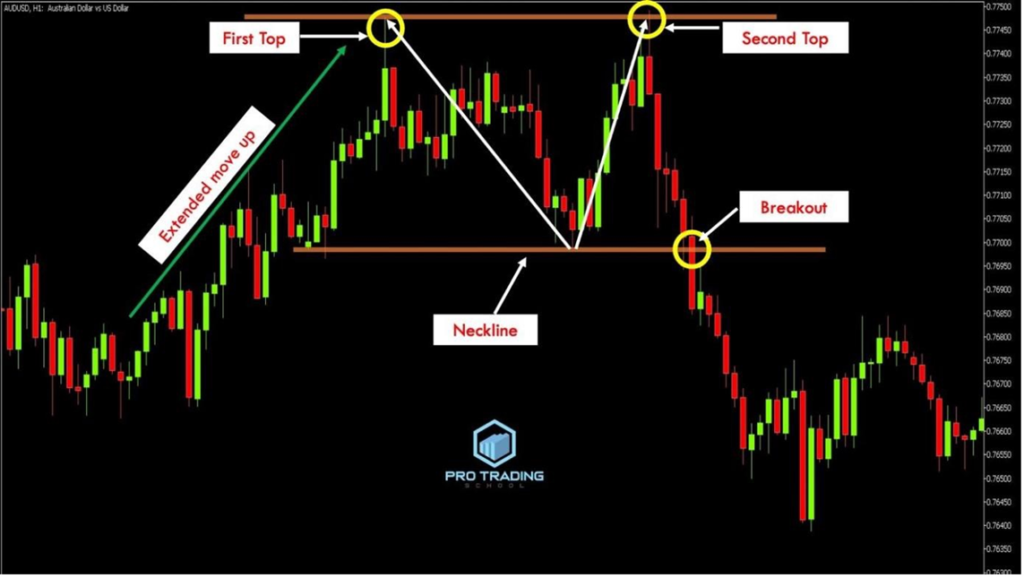
In the AUD/USD H1 chart above, the market initially made a strong upward move but was rejected at a resistance level, forming the first top.
The market then pulled back to a support level before rallying again to retest the resistance. The resistance held once more, creating the second top.
At this stage, we identify four critical elements:
- A strong upward move.
- The first top.
- The second top.
- The neckline (support level).
The double top pattern is confirmed and becomes tradable only after the market breaks below the neckline.
Here’s another example:
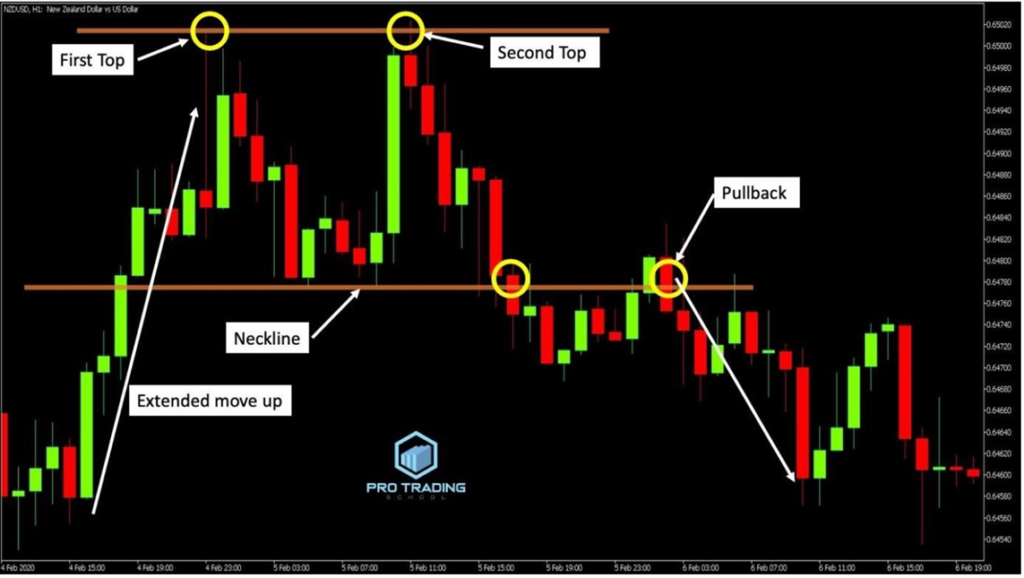
In the NZD/USD H1 chart, you can observe a textbook double top pattern. The chart highlights the four essential elements of a valid double top: an extended uptrend, the first top, the second top, and the neckline.
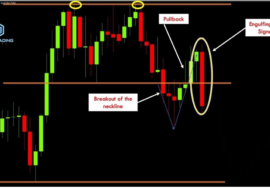
This pattern can be traded either by entering when the neckline breaks or by waiting for a pullback to retest the neckline, which will then serve as resistance.
You might even choose to enter a trade at the second top if other signals, such as a false breakout or a bearish divergence, create a confluence at that level.
Understanding the Psychology Behind the Double Top Pattern
Before discussing trading strategies, it’s important to understand the psychology driving the formation of the double top pattern.
This psychological insight is crucial because it helps you justify using this pattern as a strategy for entering and exiting trades.
To explain, let’s analyze the EUR/NZD H1 chart:
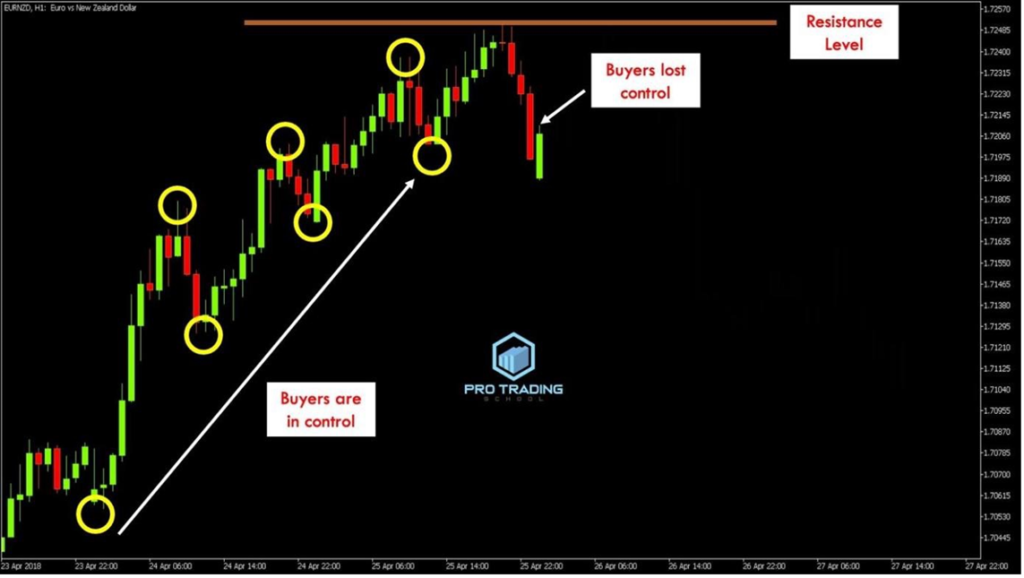
As shown in the chart, after a strong uptrend, the price encounters resistance where sellers enter the market, overpowering buyers and driving the price down.
Next, observe what happens:
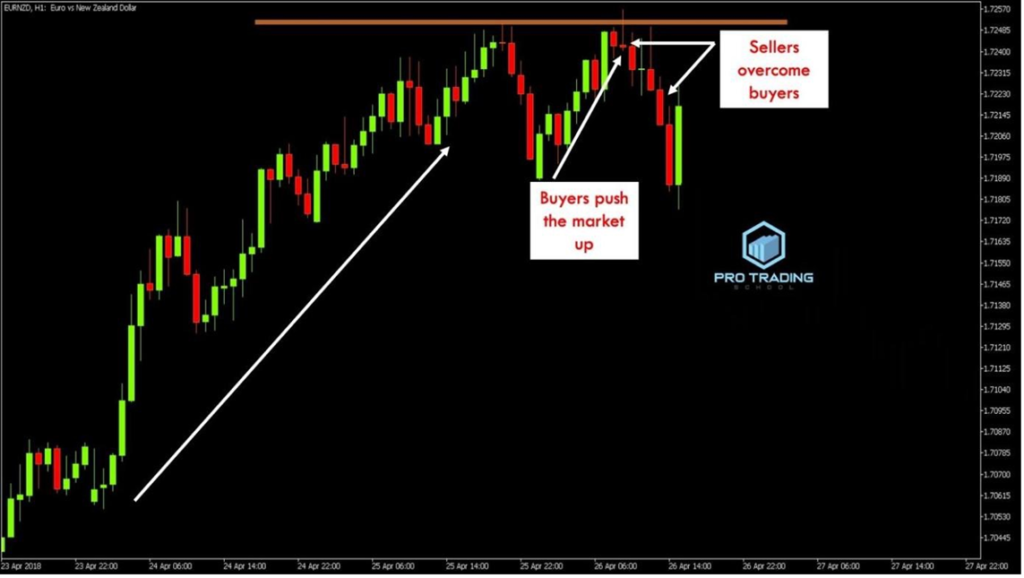
In this scenario, buyers attempt to regain control by pushing the price back up, forming a support level known as the neckline.
However, when the price reaches the previous high, sellers return with increased strength, pushing the price back down to the neckline.
At this point, the uptrend is under threat.
Other market participants, noticing that the buyers are weakening, decide to short the market.
Here’s what happens next:
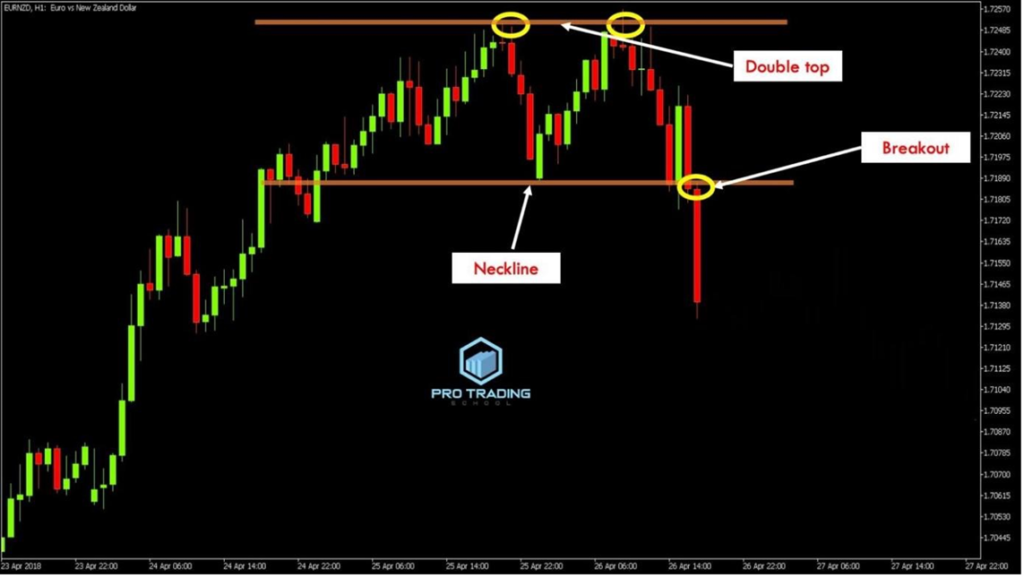
The break below the neckline (support level) confirms that sellers are now in control, signaling a likely market reversal.
With the double top confirmed, more traders enter the market, pushing the price down further.
Let’s see what happens next:
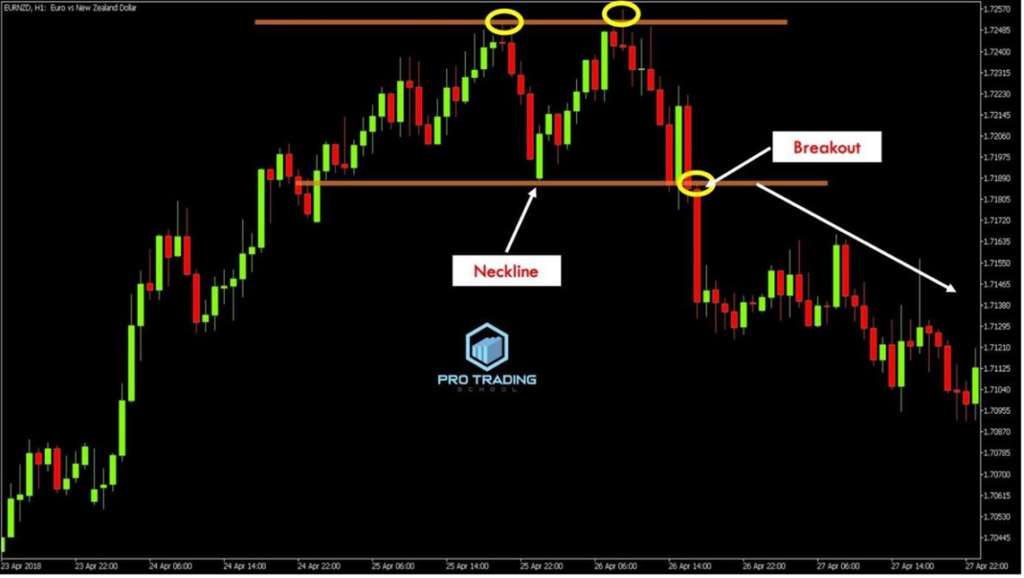
As shown, once the neckline breaks, the market continues to move lower, as traders recognize the shift in control from buyers to sellers, leading them to short the market and profit from the downward movement.
Trading the Double Top Chart Pattern
Now that you understand how to identify the double top pattern and the psychology behind it, let’s explore how to trade it effectively.
There are three main methods to trade the double top pattern:
- Method 1: Enter after the neckline breaks.
- Method 2: Wait for a pullback to the neckline after the breakout.
- Method 3: Enter early when the second top forms.
Let’s start with the first method. Consider the EUR/USD H1 chart:
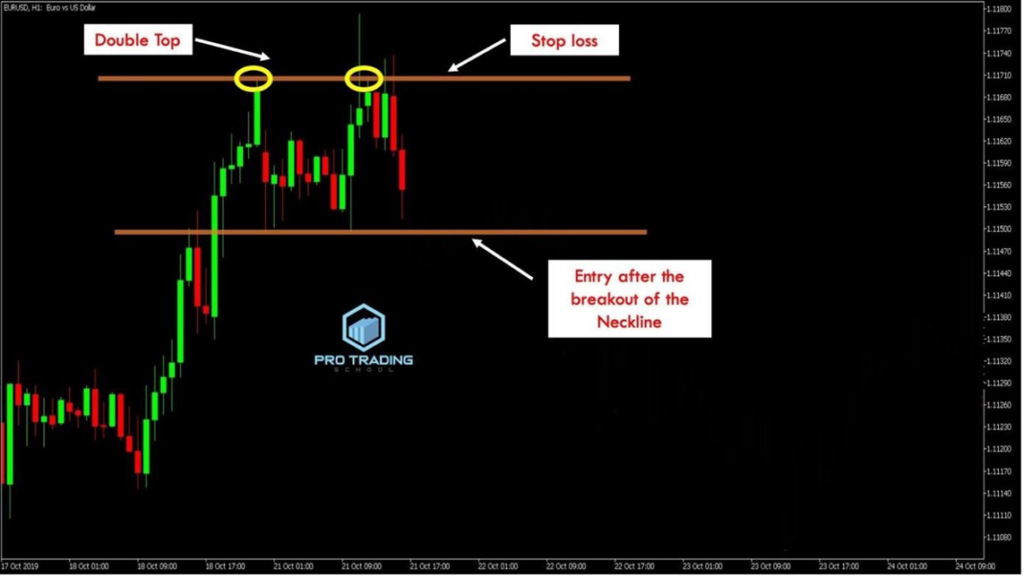
In this chart, the market is in an uptrend, indicating buyer dominance. However, the appearance of a double top pattern signals a potential bearish reversal.
At this point, you should wait for the neckline to break. Enter the trade once a candlestick closes below the neckline, and place your stop loss above the double top resistance level.
To determine your profit target, use a tool like a rectangle to measure the distance between the resistance level and the neckline.
Here’s how it looks:
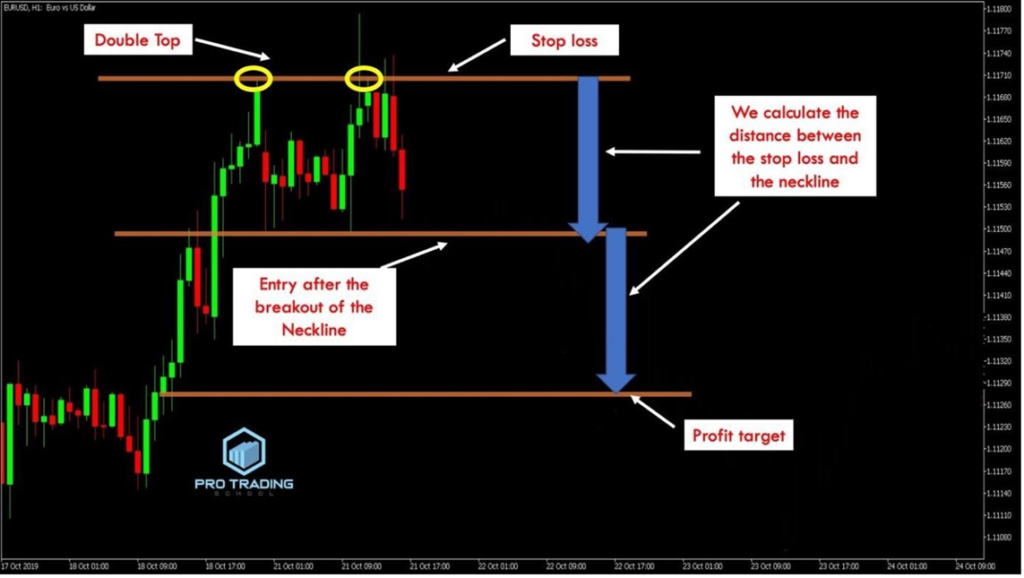
We calculate the distance from the stop loss to the neckline and use this measurement to set our profit target below the neckline.
Now, look at what happened next:
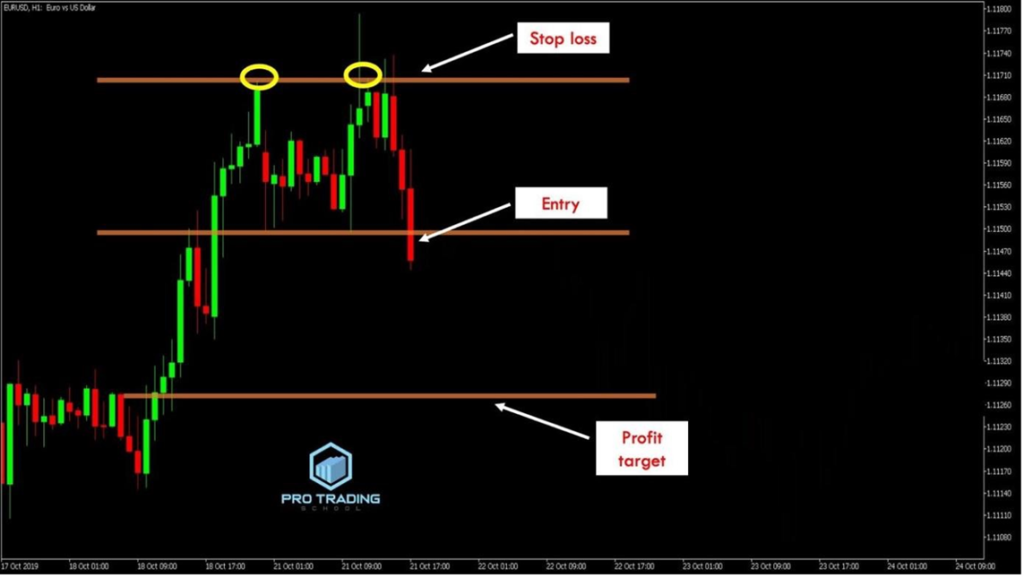
As you can see, the price broke the neckline, providing a strong signal to short the market. We placed our stop loss above the resistance level and set the profit target using the height of the pattern.
Here’s what happened next:
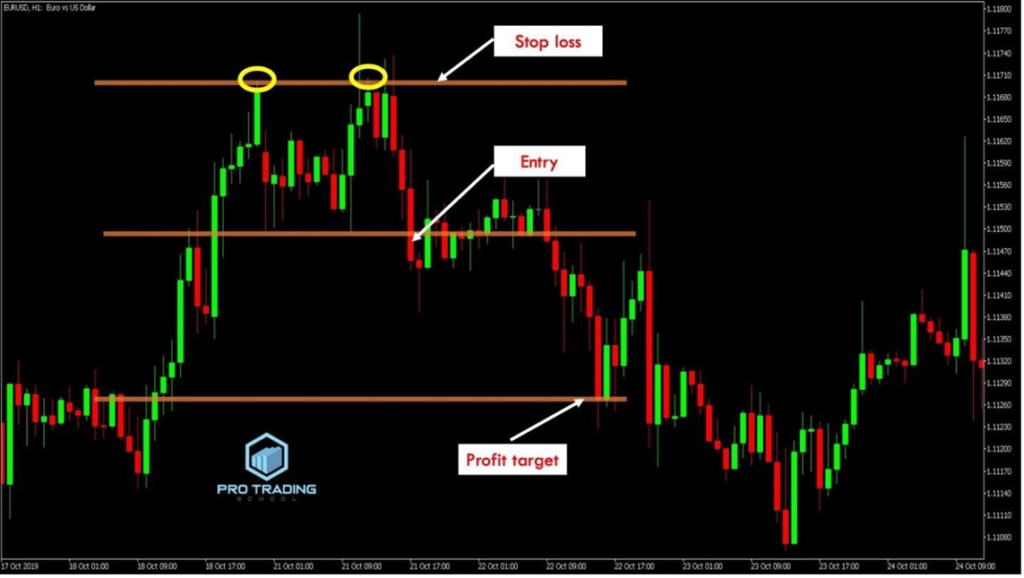
The market broke the neckline, retraced slightly, and then moved sharply downward, hitting the profit target.
Let’s look at another example:
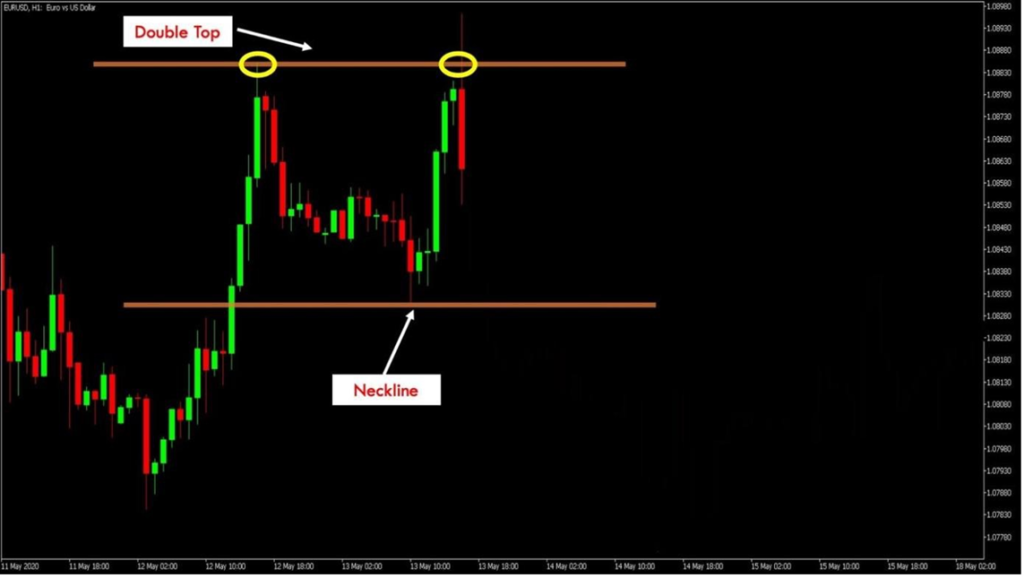
This EUR/USD H1 chart also shows a clear double top pattern, indicating a potential bearish reversal.
In the chart, we’ve identified the neckline as the support level. After waiting for the price to break below the neckline, we enter the trade:
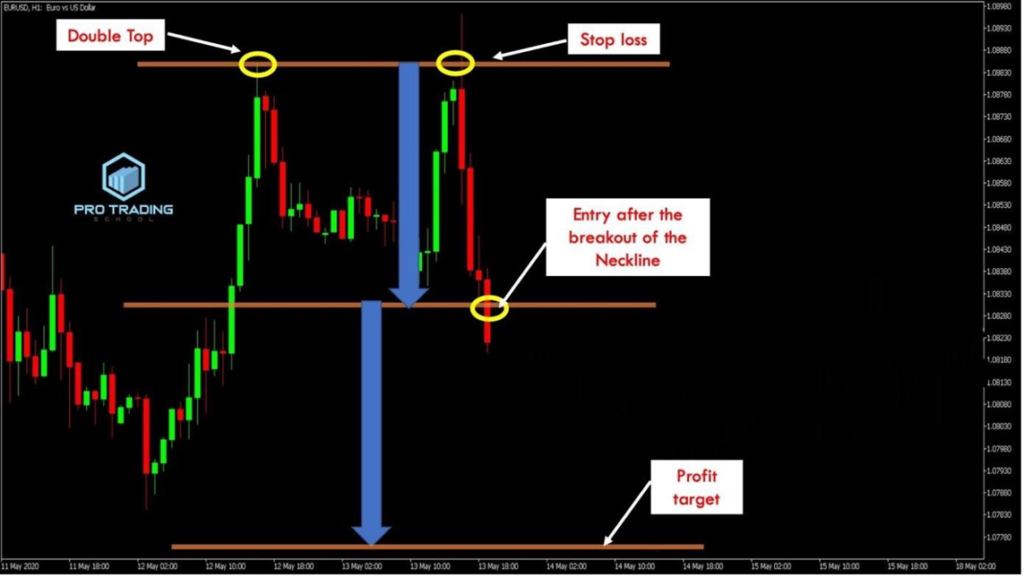
As you can see, we enter after the neckline breaks. It’s crucial to wait for a candlestick to close below the neckline to confirm the breakout.
We place the stop loss above the double top (resistance level) and calculate the profit target by measuring the height of the double top and applying it below the neckline.
Now, observe what happened:
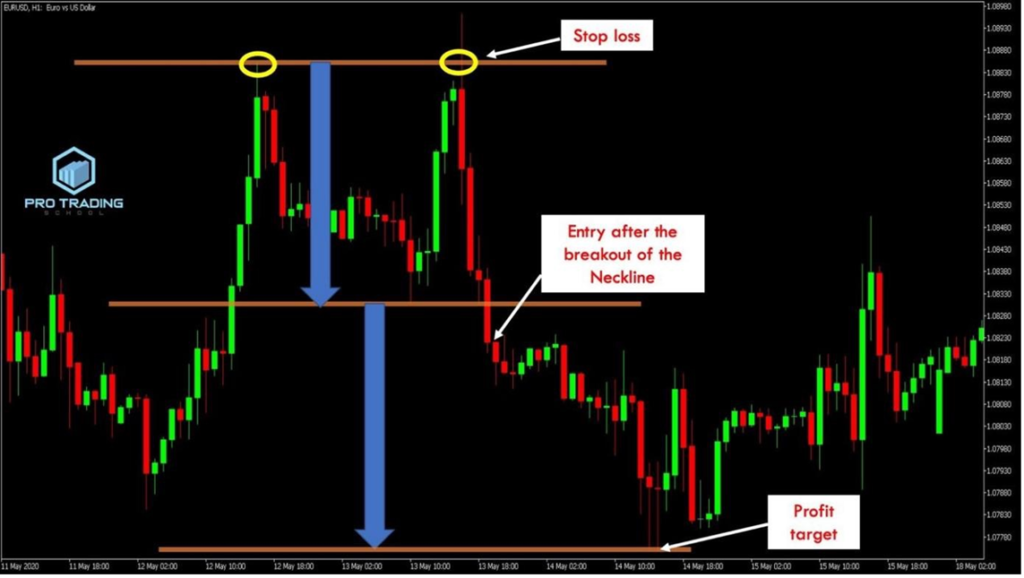
After the neckline broke, the market moved down to precisely hit our profit target.
Notice how the market was quickly rejected after reaching the profit target. This reaction occurs because many traders use similar techniques to set their profit targets.
Here’s another example:
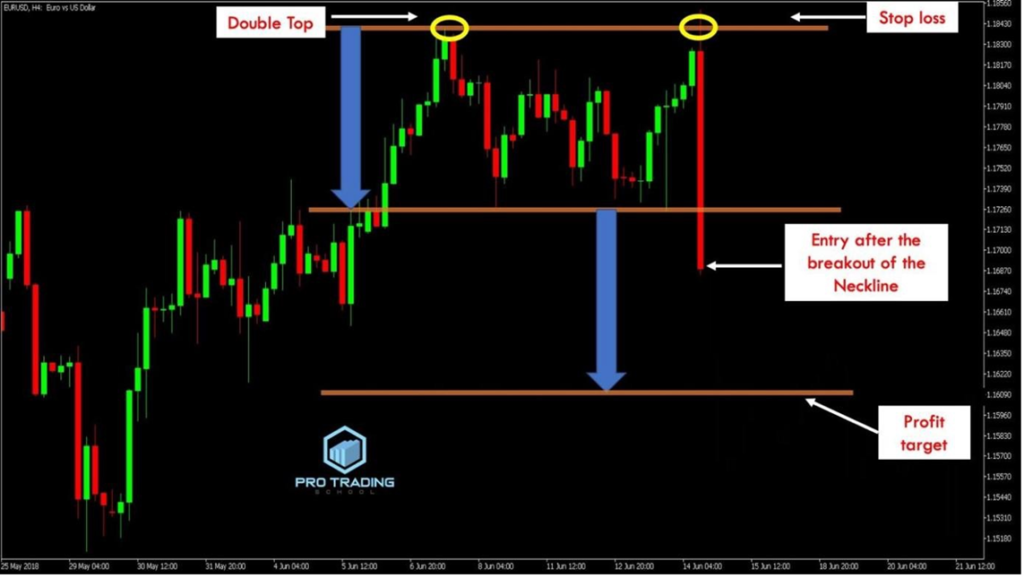
This EUR/USD H4 chart shows a strong uptrend, but the formation of the double top indicates that buyers are losing control, signaling a likely bearish reversal.
The break below the neckline confirms the double top pattern, allowing us to enter the trade at the close of the breakout candlestick.
We place our stop loss above the double top resistance level and set our profit target using the same distance between the stop loss and the neckline.
Now, see what happens next:
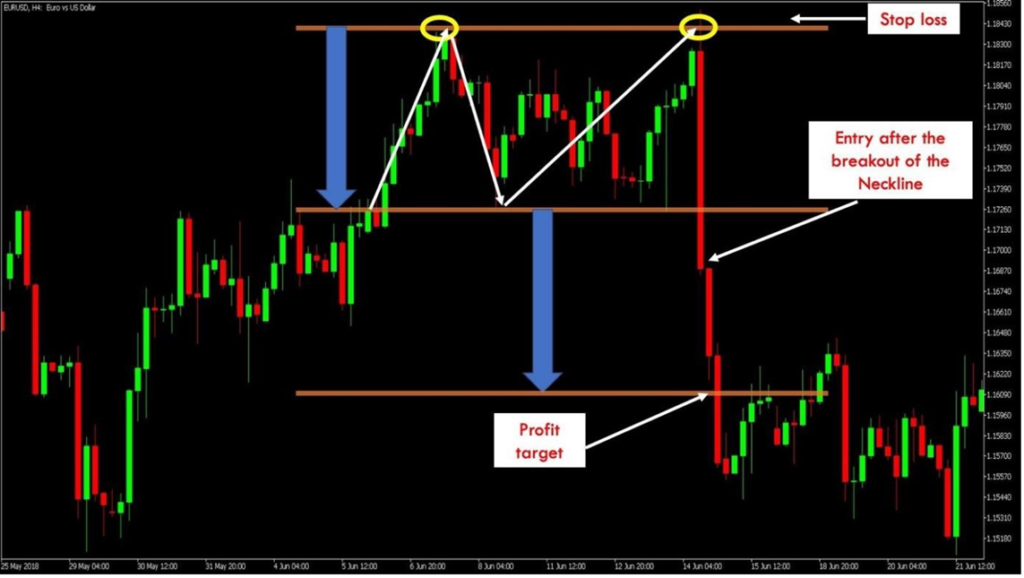
As shown, the market moved down to hit our profit target.
Using this entry method has its pros and cons:
- Advantage: You’re unlikely to miss the trade when the breakout occurs, and the win rate is high (over 90%).
- Disadvantage: The reward-to-risk ratio may not be favorable.
However, this shouldn’t be a major concern—if you can maintain a 90% win rate, you’ll still be profitable.
I’m not necessarily endorsing this strategy, as different traders have different preferences. While many may find this entry method effective, others might prefer alternative strategies, such as the pullback entry technique, which I’ll cover in the next blog post.

