The Double Top Strategy: Pullback Trading Entry Technique
The second method that traders commonly use to trade the double top chart pattern is the pullback trading entry technique.
So, what exactly is the pullback trading entry technique? This approach involves waiting for the market to retrace back to the neckline after it has broken below it.
Let’s take a look at an example using the GBP/AUD H1 chart below:
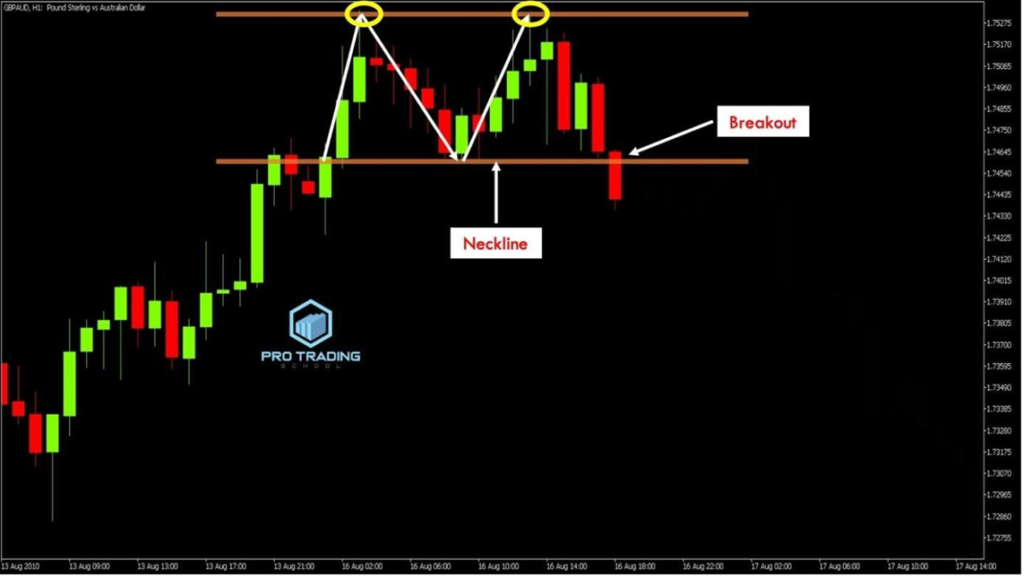
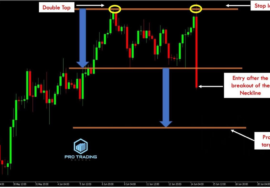
Notice how the market was in an uptrend and eventually formed a clear double top pattern, signaling a potential bearish reversal. The neckline breakout is a valid entry point, but for more conservative traders, additional confirmation may be desired. In such cases, waiting for a pullback to the neckline after the breakout can provide that extra assurance.
Now, observe what happens next on the chart:
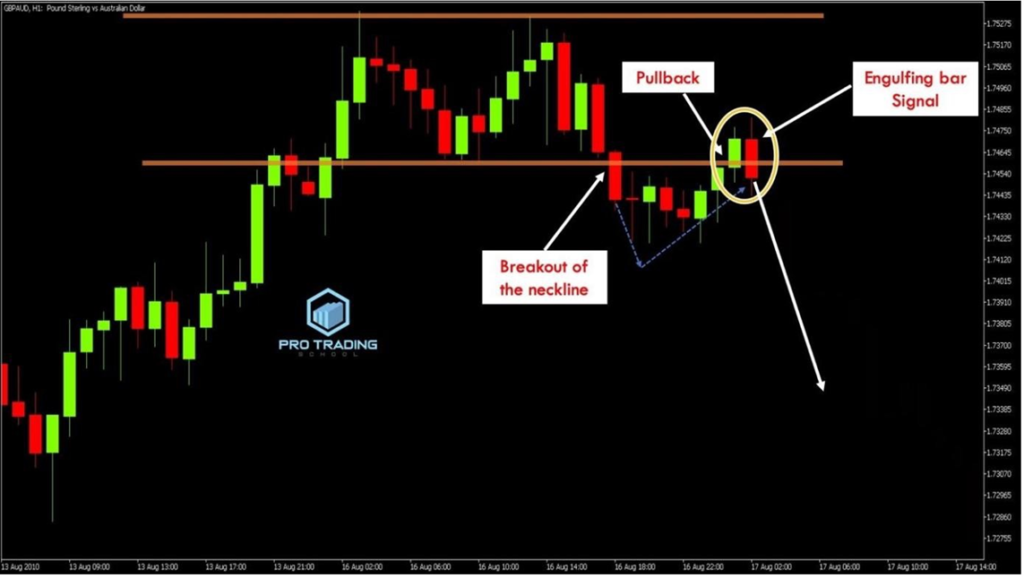
After breaking below the neckline, the market retraced to retest this level, which had now become a resistance point. At this point, a bearish engulfing candlestick pattern formed, signifying that the brief attempt by buyers to push prices back up was overpowered by sellers, leading to the end of the retracement and the beginning of a new downward impulse.
With this setup, there are four key elements that suggest a short trade is favorable:
- The formation of the double top
- The neckline breakout
- The pullback to the neckline
- The emergence of a bearish candlestick pattern (bearish engulfing bar)
Let’s go over how to place your entry, stop loss, and profit target:
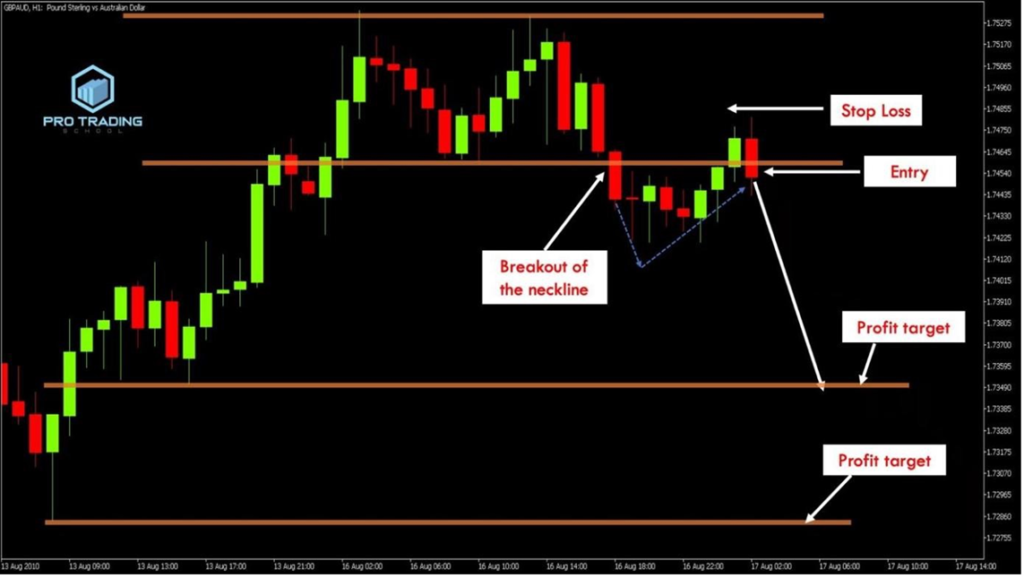
In the chart, you would place your entry at the close of the bearish engulfing bar, set your stop loss above the bar’s upper shadow, and determine your profit target at the next support level. In this example, there are two potential profit targets, and it’s up to you to decide which one to aim for. While experience will guide your choice, beginners are advised to target the first major level.
Now, see what happens next:
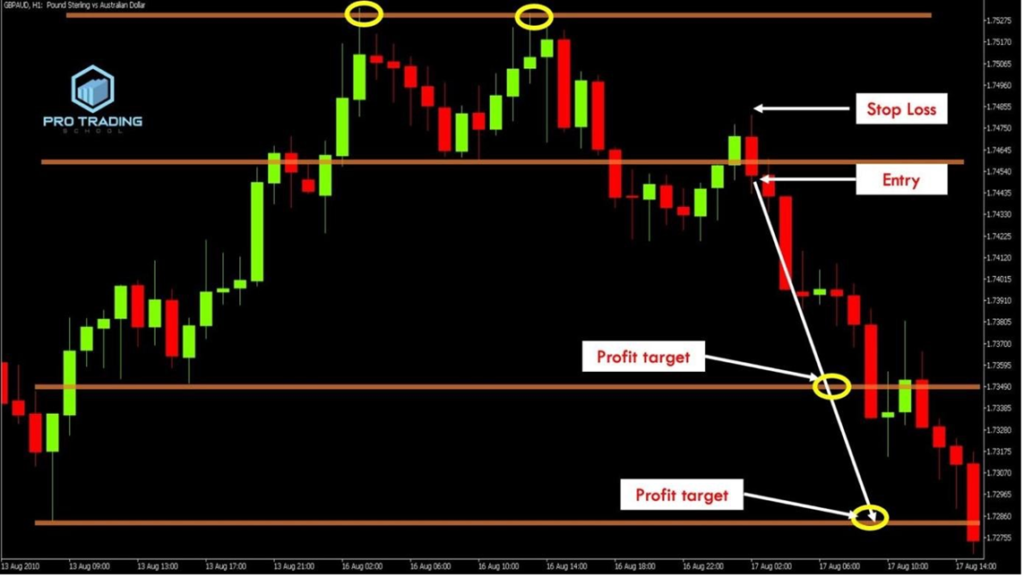
Following the bearish engulfing pattern, the market moved downward, reaching both the first and second profit targets.
Let’s explore another example with this GBP/AUD H1 chart:
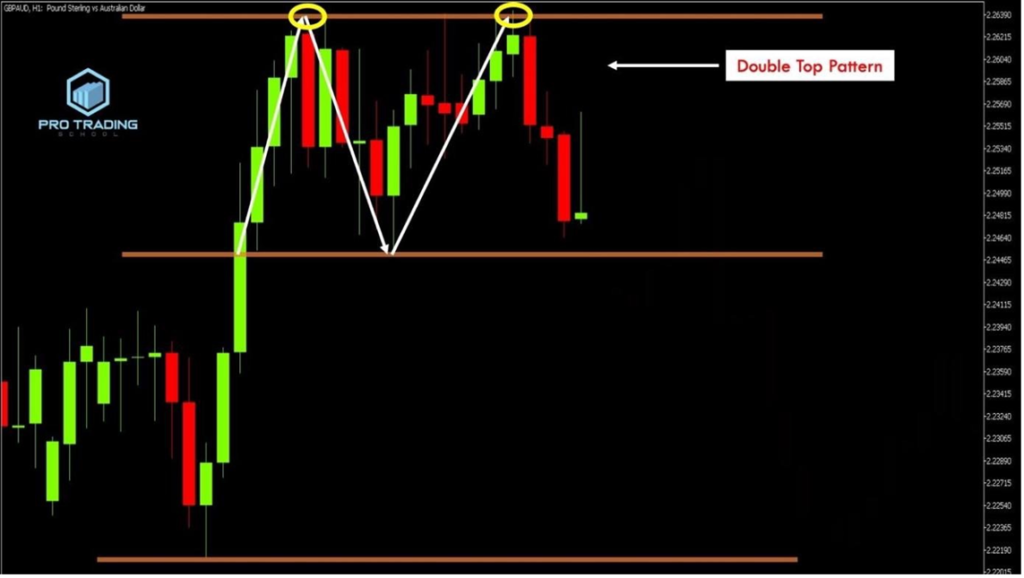
Initially, the market was controlled by the bulls, but a double top pattern eventually formed, signaling that sellers were starting to challenge buyers.
Observe the following developments:
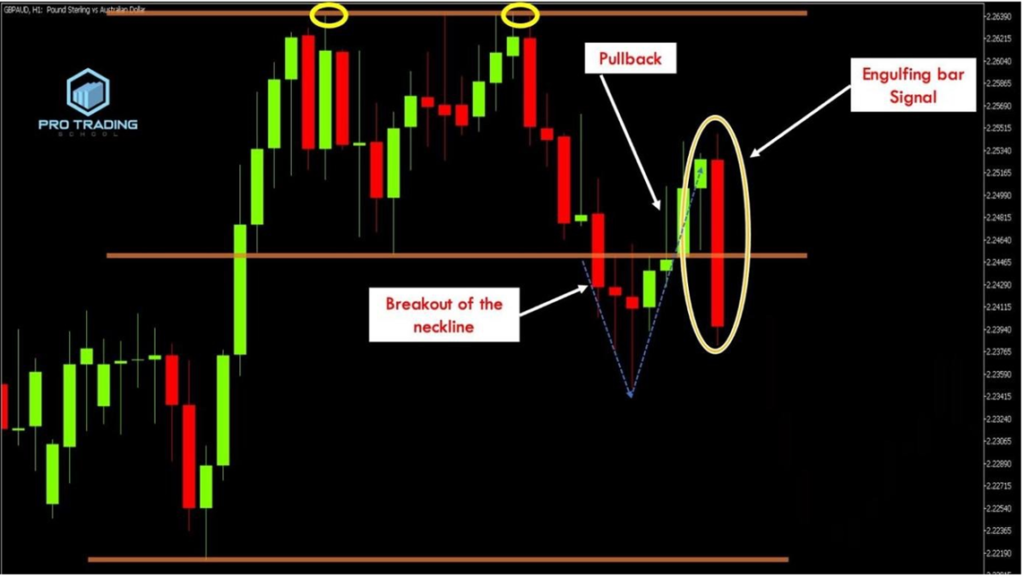
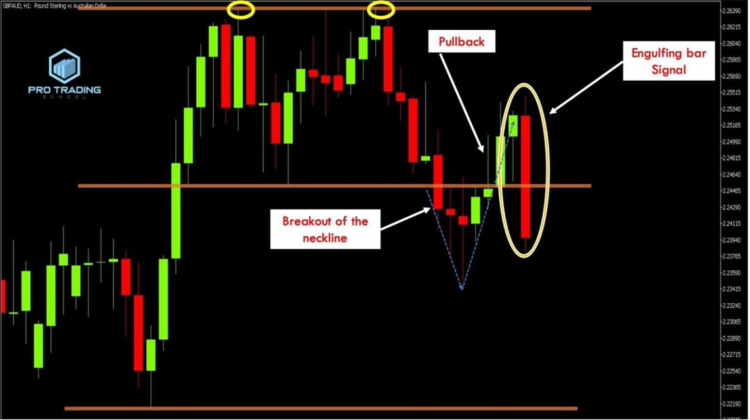
The market broke below the neckline and subsequently retraced to test it again. The formation of another bearish engulfing bar pattern confirmed the end of the retracement and initiated a new downward move.
Here’s how you would place your entry, stop loss, and profit target:
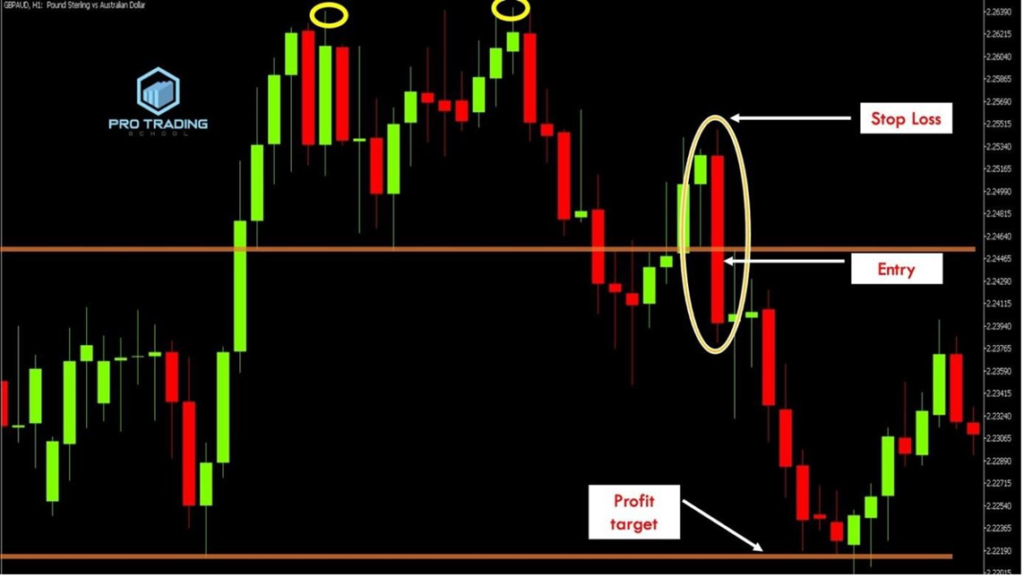
Place an entry immediately after the bearish engulfing bar breaks below the support level. In this case, the engulfing bar is large, so waiting for the candle to close might result in a poor reward/risk ratio. Set your stop loss above the engulfing candle and your profit target just above the next support level.
It’s worth noting that the engulfing pattern isn’t the only signal to use. Other reversal candlestick patterns, such as pin bars, inside bars, and dojis, can also serve as entry signals.
Let’s consider another example on a different timeframe using the EUR/AUD daily chart:
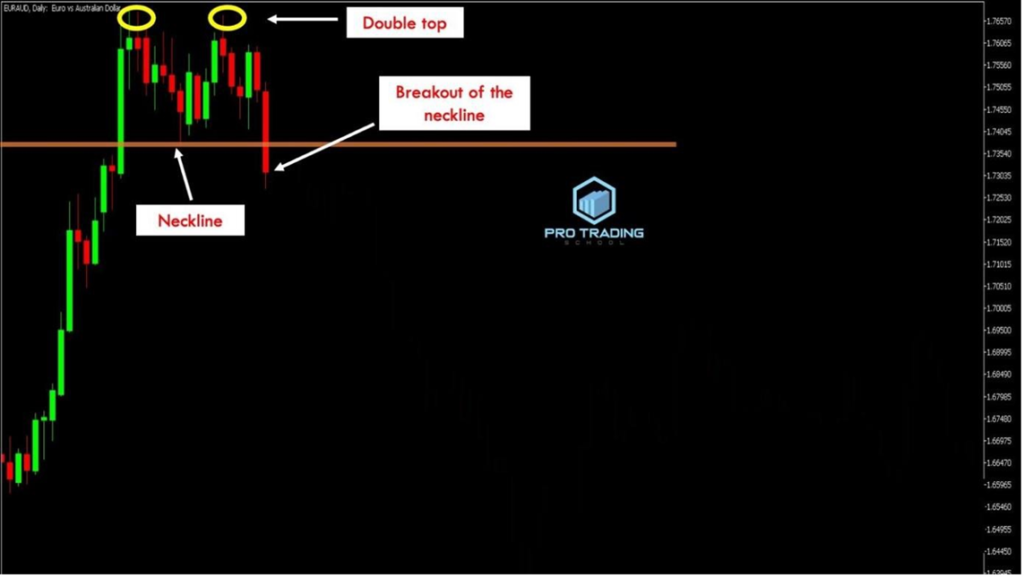
As seen here, the market was trending upwards with higher swing highs and higher swing lows. However, the formation of a double top chart pattern indicated that buyers were losing momentum, giving sellers a chance to push the market lower. The neckline breakout confirmed the validity of the double top pattern.
While entering immediately after the breakout is an option, waiting for a short retracement to the neckline—using the pullback method—can also be effective.
Look at what happens next:
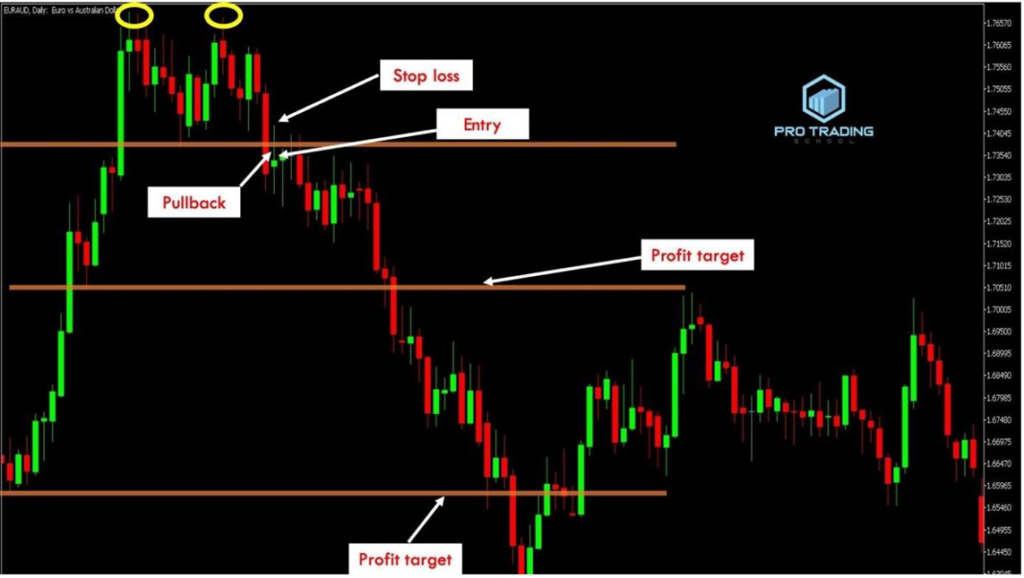
Short retracements to the neckline were met with resistance from sellers, resulting in multiple doji candlestick patterns. To enter the market, place an order at the close of any doji candle that formed during the minor pullbacks. Set your stop loss above the upper shadows and your profit target just above the first support level, or the second one if you’re more experienced.
Now, let’s weigh the advantages and drawbacks of trading double top chart pattern pullbacks:
One significant advantage of trading pullbacks after a neckline breakout is the favorable reward/risk ratio. By waiting for a pullback, you can set a tighter stop loss and aim for a larger profit target. This approach is particularly suitable for conservative traders who prefer to minimize risk.
However, the drawback is that pullbacks don’t always occur; the market may continue moving downward strongly after the breakout, causing you to miss out on trades if you were waiting for a retracement.
I’m not suggesting that trading the breakout directly is better than waiting for a pullback. Some traders succeed with the double top breakout strategy, while others find success with the pullback method. The choice ultimately depends on your trading style.
If you’re a conservative trader, you’ll likely prefer waiting for a pullback, and that’s perfectly fine. On the other hand, aggressive traders might opt to enter immediately after the breakout. You can also test this strategy with your cryptocurrency trades, you can Buy Crypto or Hodl Crypto
If you’re unsure whether you’re a conservative or aggressive trader, the best way to find out is through practice. Open a demo account, try out these strategies, and you’ll soon discover which trading method aligns best with your personality and goals.

