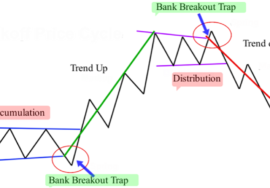
Breakout Trap Trade Example
In this blog post, I’ll walk you through a trade example to demonstrate how to effectively use bank breakout traps to maximize your profits. This strategy is straightforward, easy to implement, and highly profitable when applied correctly. Let’s dive into the first trade example.
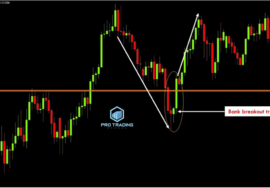
Take a look at the XAUD/USD H1 chart below:
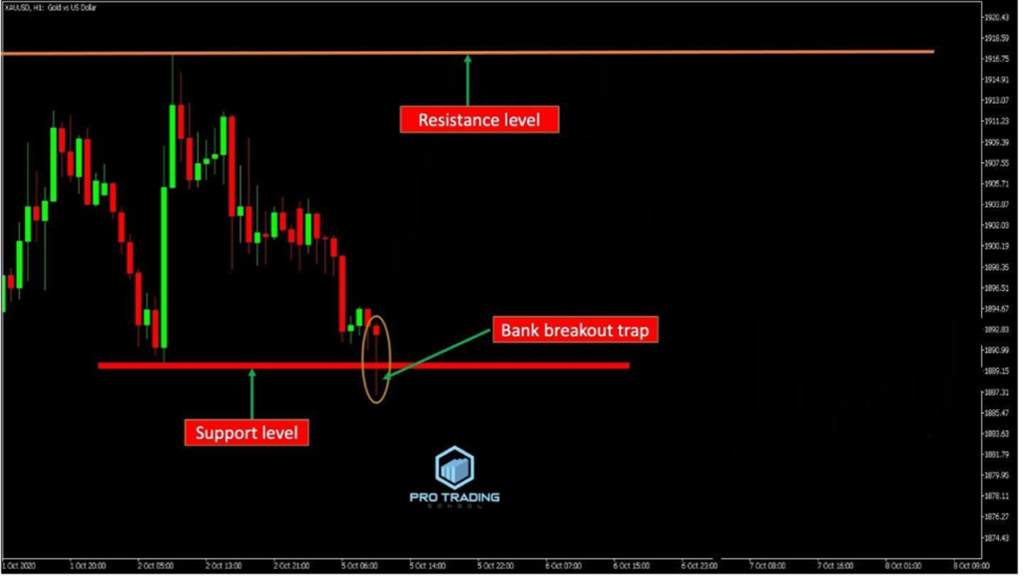
As you can see, the market has formed a well-defined bank breakout trap pattern.
However, don’t stop your analysis here; it’s crucial to switch to a higher timeframe to get a broader perspective. Since the bank breakout pattern formed on the H1 timeframe, you should check the daily timeframe to understand the bigger picture.
Now, look at the daily chart of XAUD/USD below:
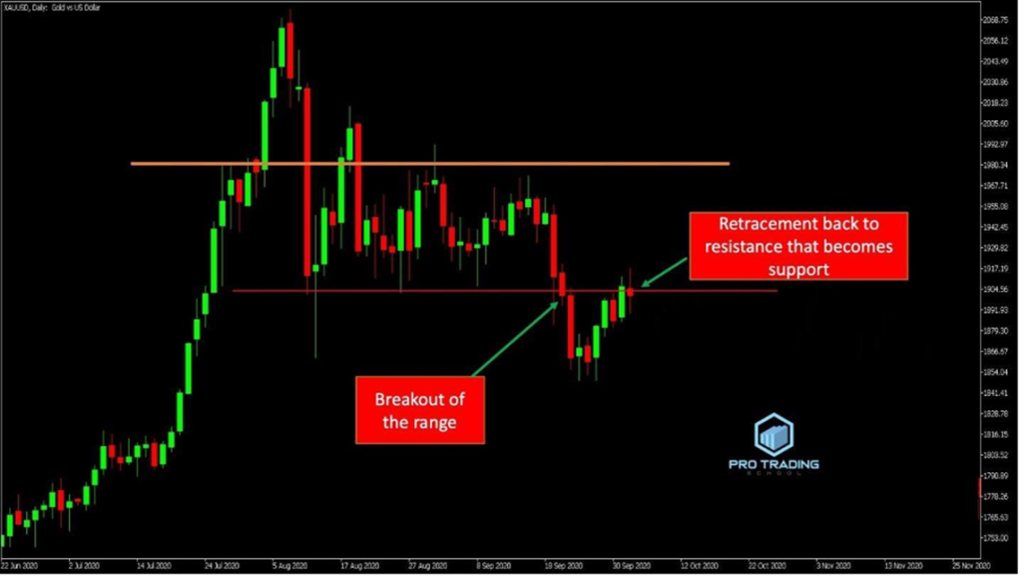
You’ll notice that the market was ranging before breaking out of the range and then retracing to test the support level, which has now turned into resistance.
So, what should we do in this situation?
Many traders might feel uncertain because they prefer to see an up-trending market on the higher timeframe to align with the hourly chart. However, this isn’t the right approach. From the daily chart, we can identify three possible scenarios:
- The market might break the resistance level and continue rising.
- The market could initiate the first impulsive move after retracing to the support-turned-resistance level.
- The market might stay at this level for a while.
In this case, the daily timeframe doesn’t provide clear guidance on what the market will do next on the higher timeframe. So, we switch back to the hourly chart to assess the strength of the trading setup.
If the setup is strong, we proceed without hesitation; if it’s weak, we stay away.
Let’s evaluate the setup on the hourly timeframe:
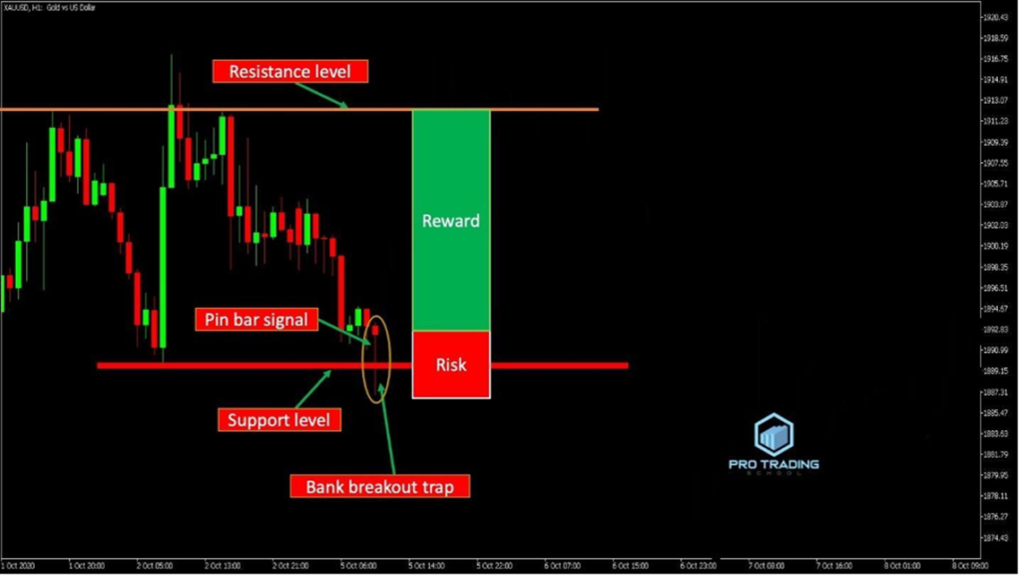
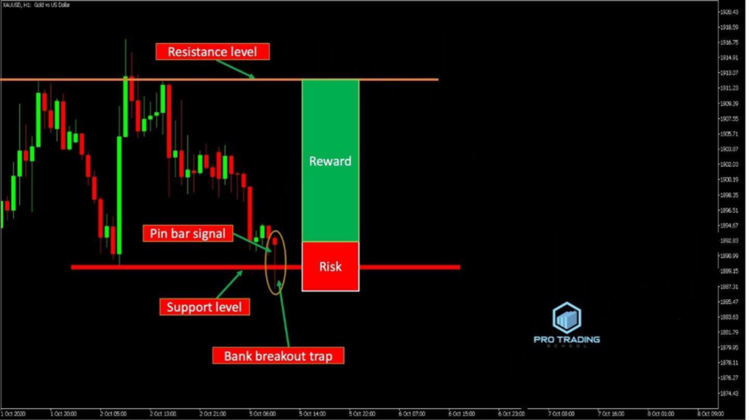
As you can see, the setup meets the following criteria:
- A false breakout of the resistance level, indicating a bank breakout trap.
- A clear support level.
- A clear candlestick signal, such as a pin bar.
- A favorable risk-to-reward ratio.
Important note: I chose to set the first resistance level as the profit target because we can’t predict what will happen on the higher timeframe. Therefore, it’s safer to take profits and exit the trade quickly.
If the higher timeframe had been trending up or at the beginning of a rally in a downtrend, we could aim for the upper resistance level as the profit target. In such scenarios, it’s reasonable to assume the market has strong potential to move higher on the hourly timeframe.
If you didn’t fully understand the explanation above, I recommend revisiting the lesson on top-down analysis to see how we integrate higher and trading timeframes.
Returning to the trade setup, it fulfills all the criteria for a strong bank breakout trap, offering a risk-to-reward ratio greater than 3:1. However, before entering the trade, we checked for the presence of any additional factors supporting the setup:
I used the RSI indicator to check for divergence but didn’t find any. However, when I applied the Bollinger Band indicator to see if the lower band rejected the pin bar signal, here’s what was discovered:
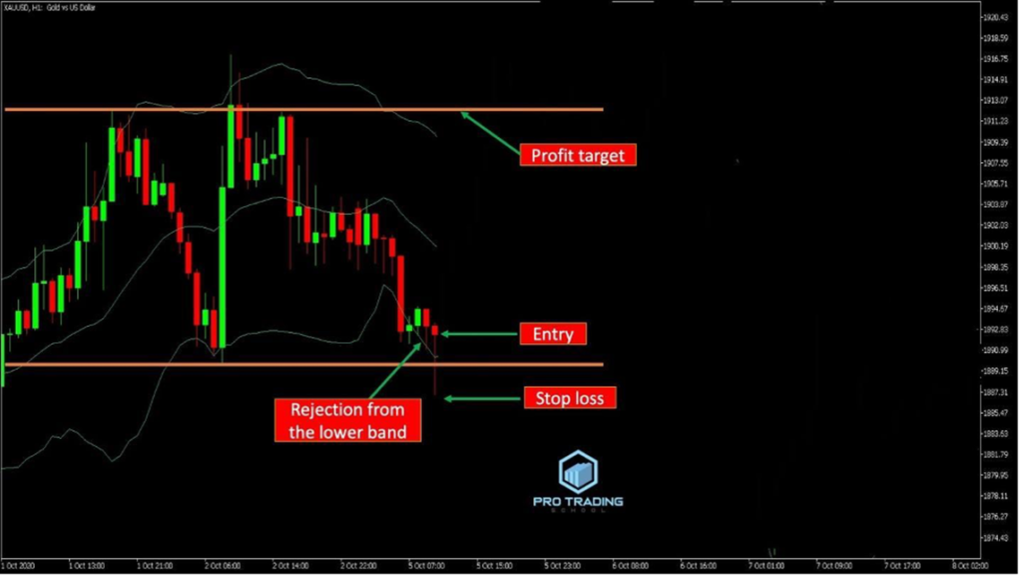
As you can see, the Bollinger Band indicator provided confirmation by showing that the pin bar was rejected from the lower band, suggesting the market is likely to move up.
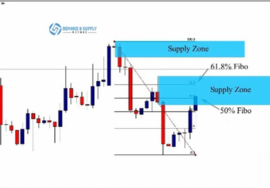
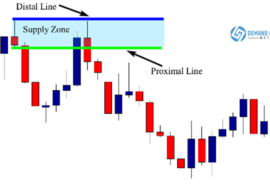
Moreover, consider the chart below:
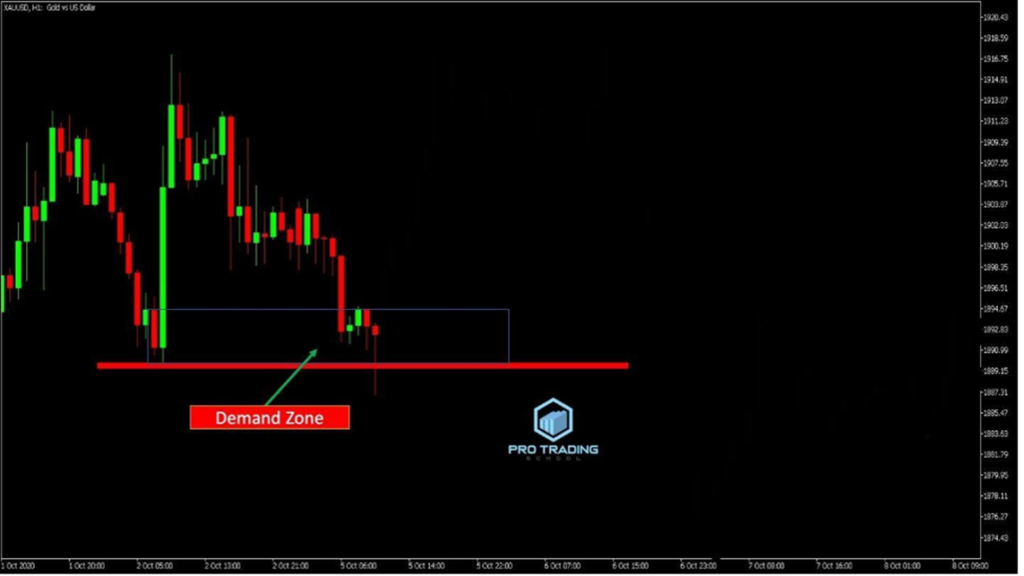
If you’re familiar with the supply and demand trading method, you’ll recognize that this area is a strong demand zone, which means there’s a high probability (up to 99%) that the price will rise from here.
Now, you have solid reasons for your trading decision. You know exactly why this trade is worth taking. In fact, if you were to share this analysis — complete with all these supporting factors — even the best traders in the world would be impressed by your market analysis.
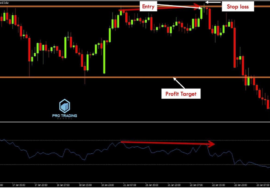
Here’s how we can enter this trade. See the chart below:
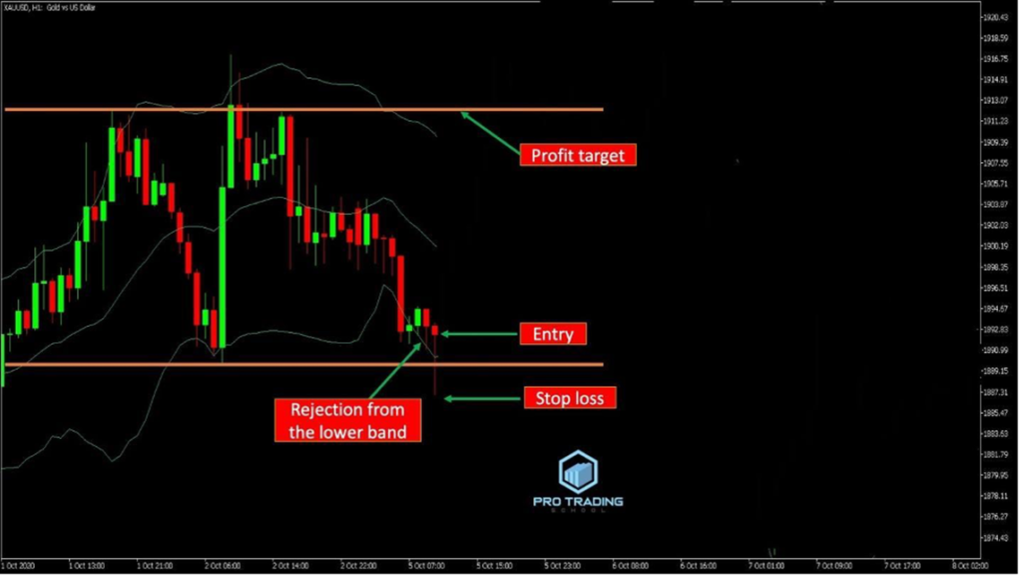
Once all the criteria are met, place your entry at the close of the pin bar. However, if the risk-to-reward ratio isn’t favorable, you can use the 50% entry method (refer to the lesson on pin bar entry techniques). The stop loss should be placed below the pin bar’s lower shadow, and the profit target should be set at the next resistance level.
Now, observe what happened next:
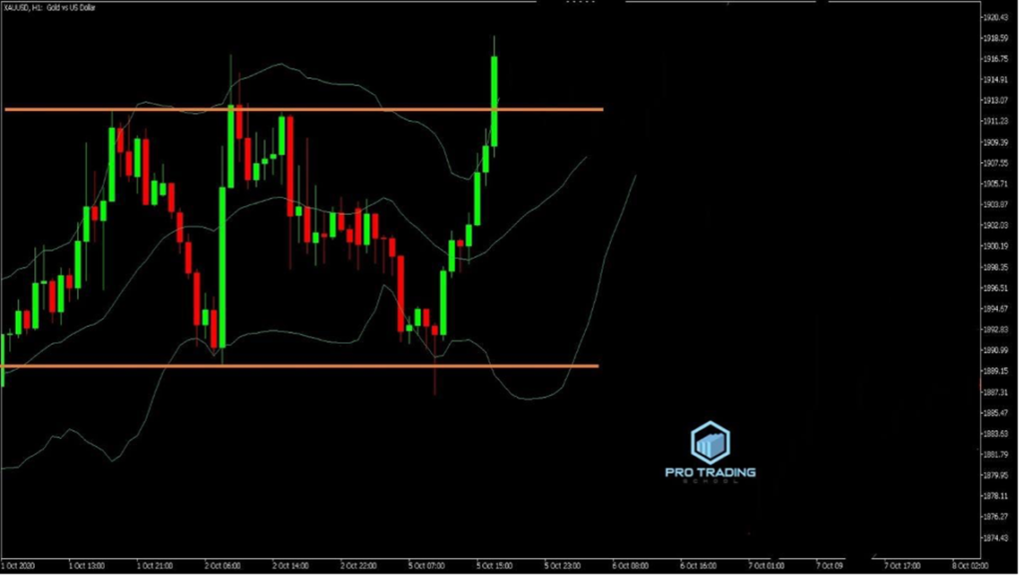
As anticipated, the market moved in our favor because we had strong reasons supporting this trade.
Important note: Don’t overlook strong trades like this one, even if there’s no additional confirming factor.
A common mistake among traders is confusing confirming factors with the criteria used to evaluate a trading setup. The criteria for evaluating a setup are more important than the confirming factors. Confirming factors, like the Bollinger Band or RSI divergence, provide extra confidence but aren’t the primary reason for taking the trade.
So, if you find a high-probability trading setup but can’t identify a confirming factor, such as a Bollinger Band rejection or an RSI divergence, you can still take the trade.

