The Doji Bank Breakout Combined with RSI Divergence
One of the most effective ways to spot a market turning point is by using divergence signals. These signals can help determine whether the market is likely to reverse upon reaching a support or resistance level. Divergence is identified using oscillating indicators like the RSI, which is one of the most popular and widely utilized tools.
However, RSI divergence should not be used in isolation; instead, it should serve as one of the confluence factors in this strategy.
Before diving into the other factors involved in this strategy, it’s essential to understand what divergence is. Divergence occurs when the market and the indicator are out of sync — for example, when the price is making a higher high while the indicator is making a lower high.
Many traders use RSI divergence as a standalone strategy and find success with it. However, in this trading approach, RSI divergence will be used as just one of several confluence factors to identify high-probability trade setups.
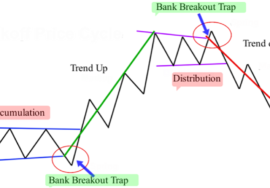
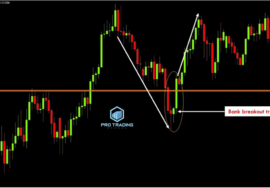
To use divergence effectively in this strategy, the first step is to identify a clear doji bank breakout trap, as this is the pattern we’ll be trading. Once the doji bank breakout trap criteria are met, we then apply the RSI indicator to see if it aligns with our trading decision.
Let me illustrate this with an example from the AUD/USD H4 chart:

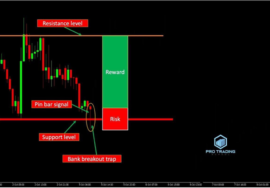
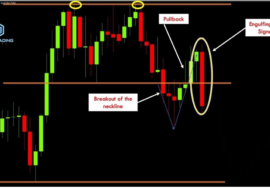
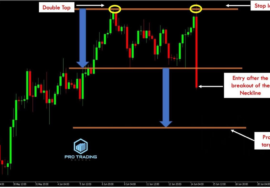
As shown in the chart, the market is moving sideways between support and resistance levels. A doji candlestick forms at the resistance level, creating a clear bank breakout trap. This gives us a strong signal, but it’s crucial to assess the risk-to-reward ratio.
Take a look at the chart below:

Upon evaluating the risk-to-reward ratio, we find that this trade offers at least a 5:1 reward-to-risk ratio. This is significant because if the trade goes in our favor, it would take five consecutive losses to negate the profit from this single trade. This underscores the importance of evaluating the risk-to-reward ratio in your trading decisions.
With the trade deemed worth the risk, we can now check for any divergence between the price and the RSI indicator, which would provide additional confirmation for taking this trade.
Observe the chart below:
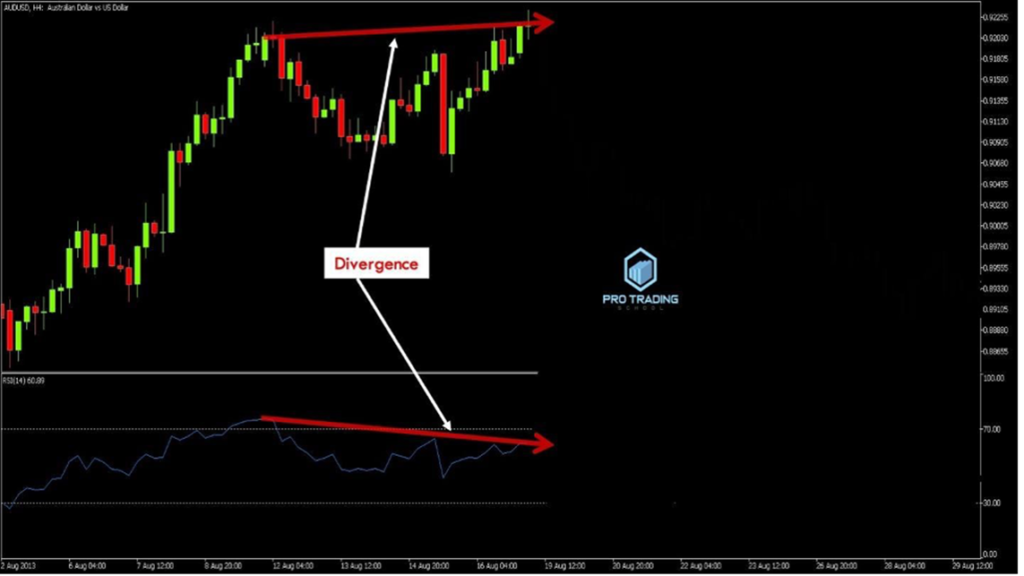
As you can see, there is a clear divergence between the price and the RSI indicator, indicating a potential market reversal. The confluence of multiple factors — the doji bank breakout trap and RSI divergence — enhances our confidence in the trade.
This confidence is critical, as many traders hesitate to execute trades due to a lack of solid reasoning. By having a confluence of multiple factors, you can feel assured in your decision to enter the trade, knowing that not only is there a bank breakout trap, but also a clear divergence supporting the signal.
Now, let’s look at what happened next:
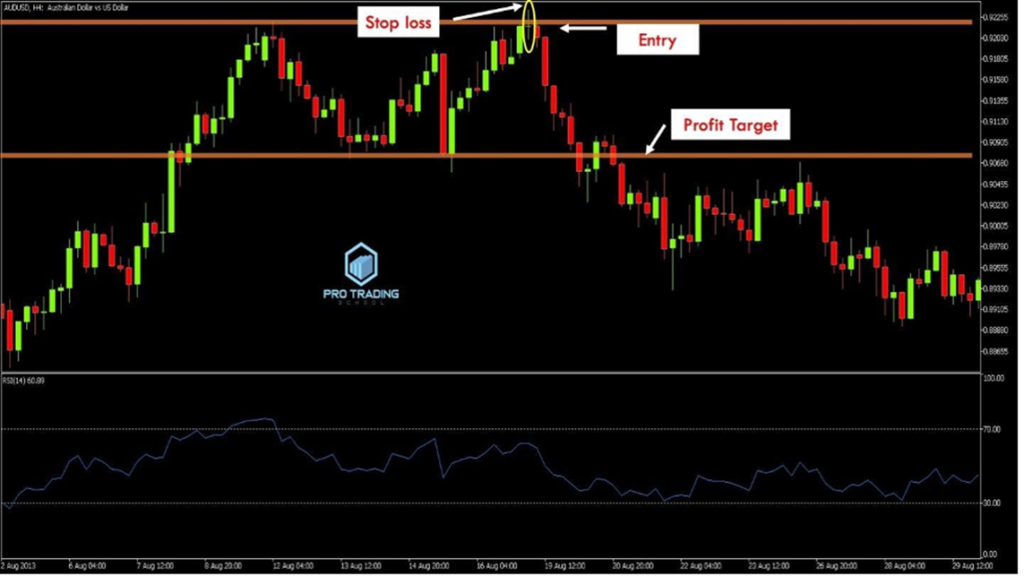
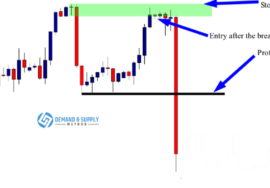
After the doji bank breakout trap formed and the RSI showed bearish divergence, the price indeed dropped, reaching the support level. To execute this trade, you would place a sell order at the close of the doji, set a stop loss above the upper shadow, and target the next support level for profit.
Here’s another example to help clarify how we can combine the RSI with the doji bank breakout trap for a confluence of signals:
Consider the EUR/AUD H1 chart below:
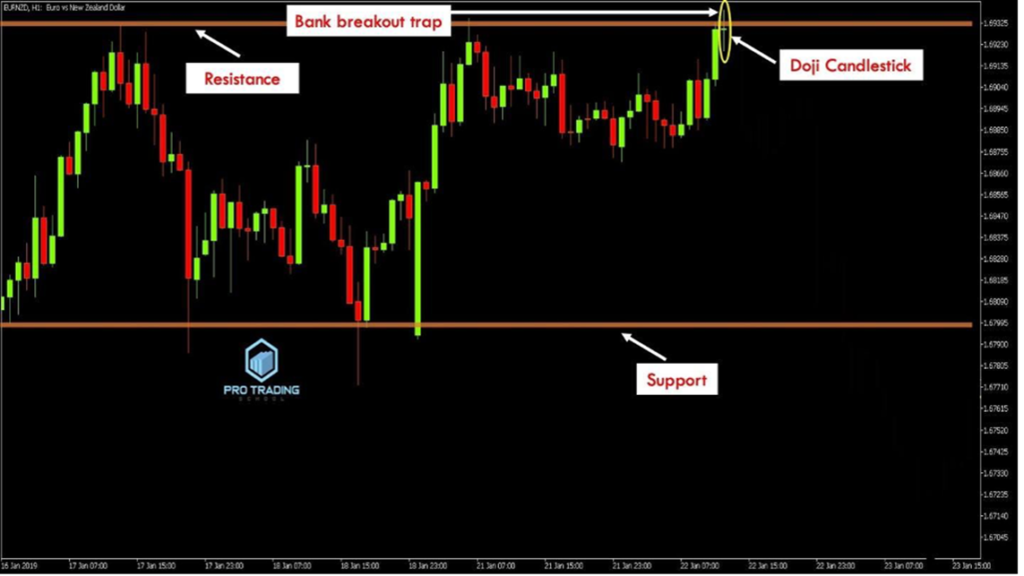
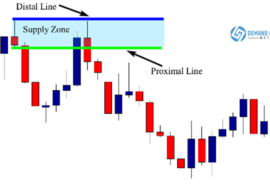
In this chart, the market is ranging between support and resistance. A doji candlestick forms at the resistance level, creating a clear bank breakout trap. At this point, we have three key elements:
- A ranging market
- A doji candlestick at the resistance level
- A bank breakout trap (false breakout)
Next, we evaluate the reward-to-risk ratio to determine if the trade offers a good reward. See the chart below:
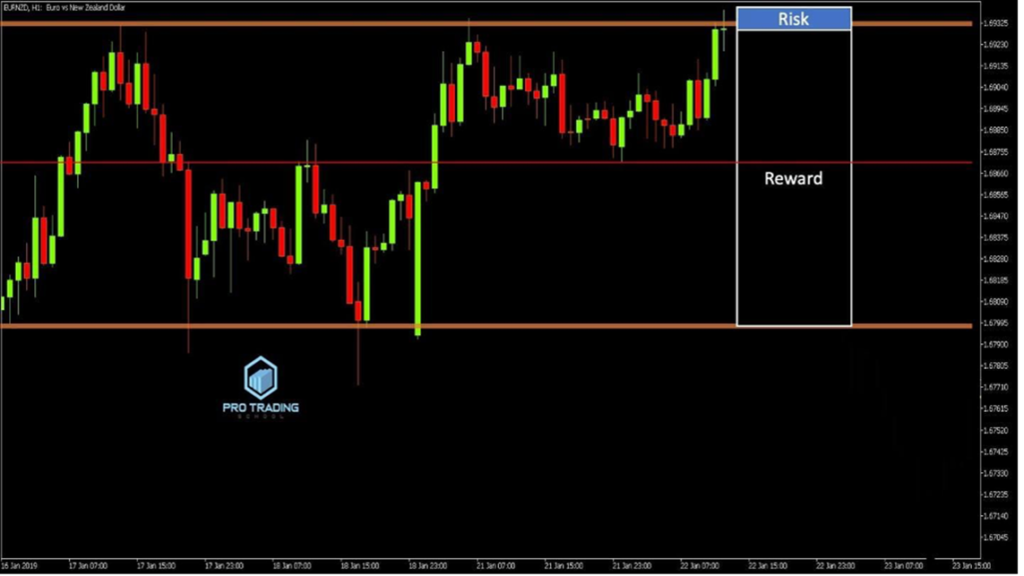
Upon reviewing the reward-to-risk ratio, we find that this opportunity provides more than an 8:1 reward-to-risk ratio. This means for every $1 risked, there’s a potential $8 gain.
I always stress the importance of taking trades with at least a 2:1 reward-to-risk ratio because strong money management is key to long-term success. With a 2:1 ratio, you can still be profitable even if you lose six out of ten trades.
Once we’ve confirmed that the trade offers a favorable reward-to-risk ratio, we check for divergence between the price and the RSI indicator. If present, this divergence supports the bank breakout trap signal and strengthens our conviction to take the trade.
Observe the chart with the RSI indicator applied:
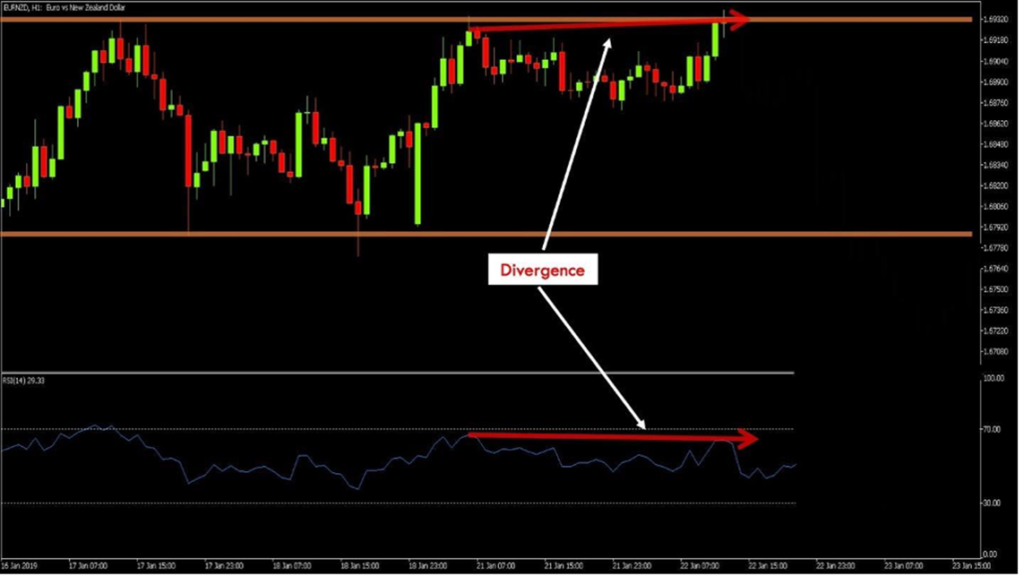
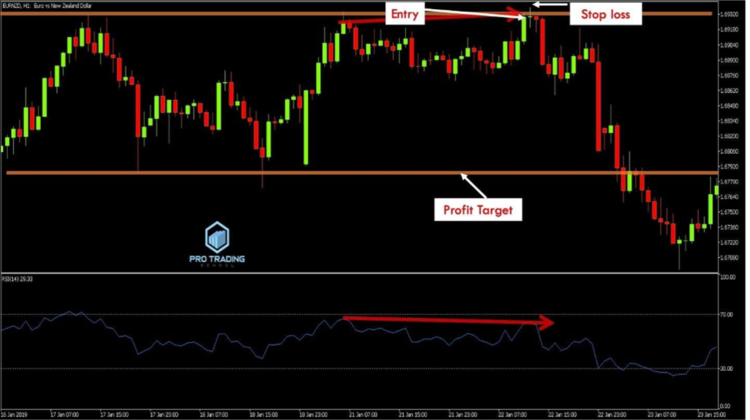
As shown, there’s a clear divergence between the price (which is making a higher high) and the RSI indicator (which is making a lower high). This divergence signals a potential price reversal.
With all the necessary elements in place — a ranging market, a doji at the resistance level forming a false breakout, a favorable reward-to-risk ratio, and RSI divergence — we can proceed with the trade, confident that the market is likely to move in our favor.
To execute this trade, place a sell order at the close of the doji, set the stop loss above the upper shadow, and target the next major support level for profit.
Finally, look at what happened next:
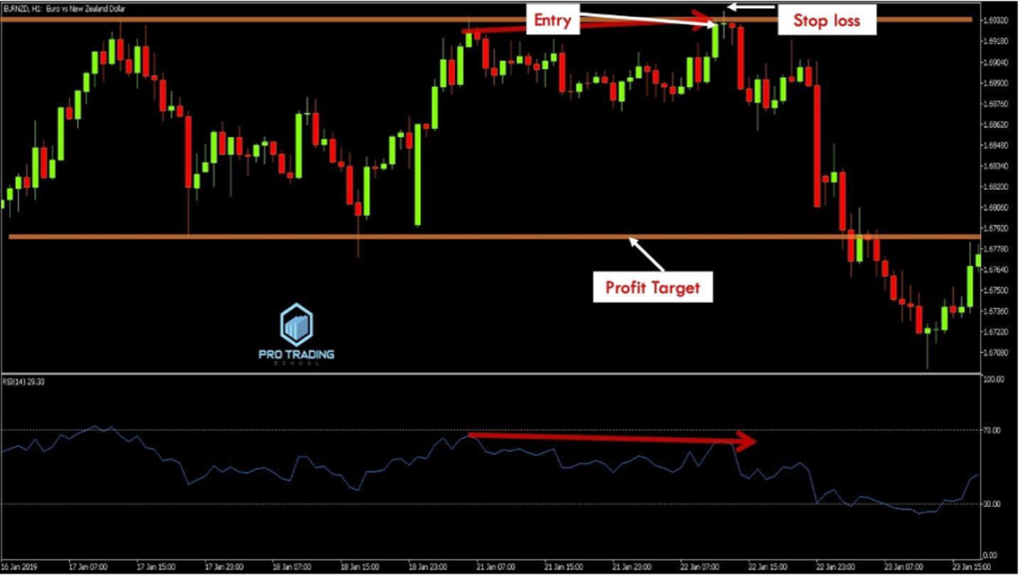
As expected, after the formation of the bank breakout trap and the RSI showing divergence, the market declined, reaching the support level.
Trading the doji bank breakout trap in combination with RSI divergence is both straightforward and profitable. However, this setup doesn’t occur frequently. If you don’t find a divergence, you can use the Bollinger Band to check if the doji is rejected from the upper or lower band.
Sometimes, you may encounter a doji bank breakout trap with a good reward-to-risk ratio but without RSI divergence or Bollinger Band rejection. This shouldn’t prevent you from taking the trade, as the confluence factor only provides additional confirmation and isn’t the primary reason for the trade.

