The Bank Breakout Introduction
The Bank Breakout Introduction
To become a successful trader, it’s crucial to accept that the market is full of traps. This is simply the nature of financial markets. Banks and financial institutions profit by trapping retail traders. If you can’t accept this reality and begin learning about these traps, you’ll eventually find yourself out of the trading game.
Winners in this industry focus on building their knowledge and skill set to understand how the market operates rather than just complaining. Therefore, it’s essential to learn about these market traps and how to use them to your advantage.
Understanding the workings of the market gives you an edge over those who overlook important details, especially when it comes to traps and manipulations. When you fall into a trap, you lose money — you could even lose your entire trading account if you don’t understand how things work.
As retail traders, we can’t control or change the way banks and financial institutions play the game. They have far more power, with huge trading accounts that can move the market at will.
The only way to survive in the market is by studying their strategies and tactics, and then following their footprints.
Banks and financial institutions are well aware of how retail traders analyze and trade the market. They have teams of technical analysts who study charts and identify the most important patterns that retail traders use to find their entries. They then use this knowledge to trap retail traders and take their money in a smart and easy way.
One of the strategies that banks and financial institutions use to manipulate retail traders is known as the Bank Breakout Trap. So, what exactly is a bank breakout trap?
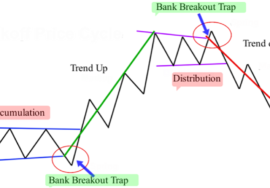
The bank breakout trap occurs when the price breaks out of an obvious level, only to suddenly reverse direction. When the initial breakout happens, many traders enter the trade in the direction of the breakout. These traders become trapped when the price reverses, triggering a cascade of stop-loss orders.
Once this happens, new institutions often enter the market, adding further pressure to the price. This reaction can evolve into a new trend opposite to the initial breakout.
Take a look at the chart below:
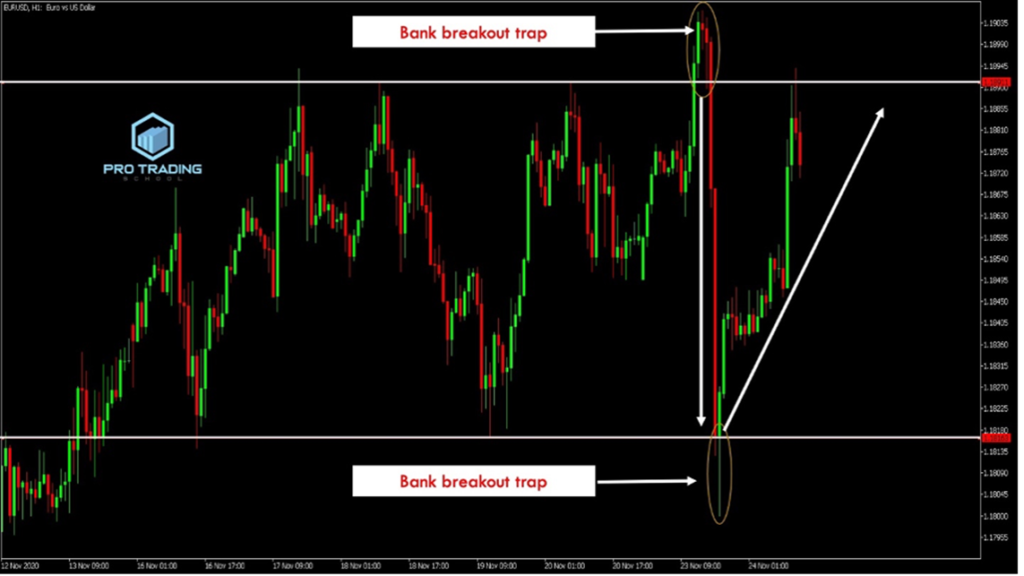
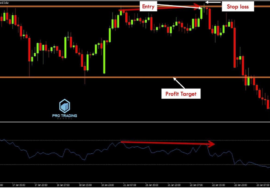
In the EUR/USD H1 chart above, the market was ranging and formed two bank breakout traps at the boundaries of the range. The first was at the resistance level, and the second was at the support level. Banks and financial institutions often use ranging markets to set their traps and manipulate retail traders.
In this chart, you can clearly see a bank breakout trap that was formed at the resistance level. The market broke above the resistance level, giving the impression that the range-bound movement was over and that a new uptrend was likely emerging.
Of course, the trapped traders entered the market following the breakout, likely placing their stop-loss orders below the resistance level. When the price reversed, those traders who were deceived by the false breakout were stopped out as the price fell sharply.
It’s likely that new financial institutions joined the down move because they often trade these lucrative patterns.
The same scenario unfolded when the market reached the support level. Institutional buyers pushed the market lower to create the impression that it had broken below the range and would start trending downward. As retail sellers entered the market, these buyers pushed prices back up above the support level. This pattern is what we call the bank breakout trap.
If you’re unaware of the bank breakout trap and how to use it to your advantage, you could lose a lot of money. Banks and financial institutions understand how retail traders think and will often trick you into taking the wrong direction.
When you try to predict a breakout of a key support or resistance level early, they give you what you want — they break the key level. If you enter the market based on this, you’ll often find that your stop loss is quickly triggered as the market reverses sharply in the opposite direction.
Let me provide another example with this USD/JPY daily chart below:
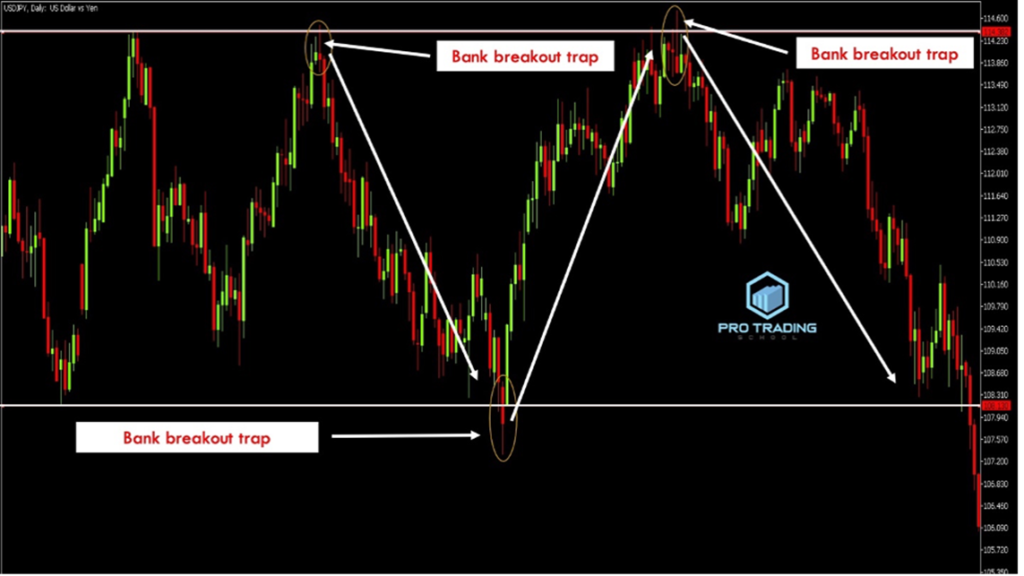
As shown in the chart above, the market was ranging, meaning buyers and sellers were in equilibrium. Neither side was dominating the market.
Most traders wait for a ranging market to break out of the resistance or support level before making an entry, as the breakout of one of these levels signals the end of the ranging period and the start of a new trend. Amateur traders, in particular, want to enter at the beginning of the breakout to ride the new trend.
Banks and financial institutions know how most retail traders think, so they create the scenario we are waiting for. And when we feel safe to put our money in the market, they enter to take our money and then move the market in the opposite direction.
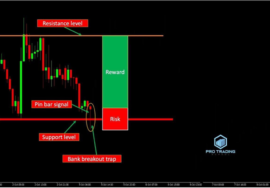
A bank breakout trap pattern can be formed by one candle or multiple candles, as shown in the chart above. The first bank breakout trap was created by a single pin bar candlestick pattern. The second was formed by two candlesticks: the first was a red candlestick that was rejected but still closed below the support level, and the second was a green candlestick that closed above the support level.
We will study the different bank breakout trap patterns in detail in future lessons. This post is just an introduction to these concepts so you can get a sense of what we will be exploring.
Bank breakout traps can be observed across all timeframes — both higher and lower timeframes. They can occur not only in ranging markets but also in trending markets.
Consider this AUD/CHF H4 chart as an example:
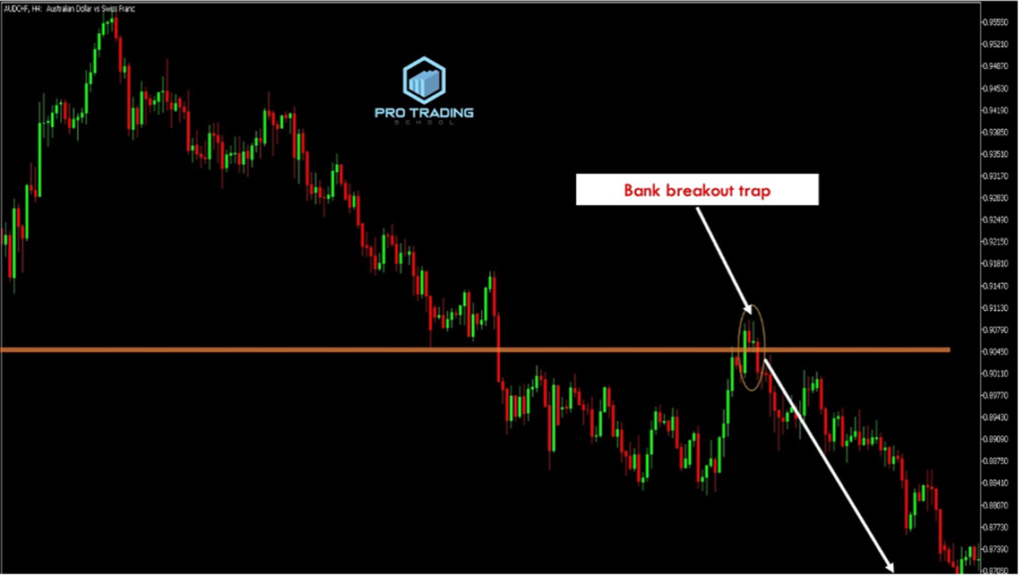
In this chart, the market was trending down, and when it retraced to test the resistance level, it broke above it, suggesting a potential reversal.
Once buyers were trapped in this breakout, sellers pushed the market lower in line with the downtrend direction.
In this example, amateur traders tried to enter at the beginning of the breakout to ride the reversal, but the breakout was simply a bank trap.
Look at another example below:
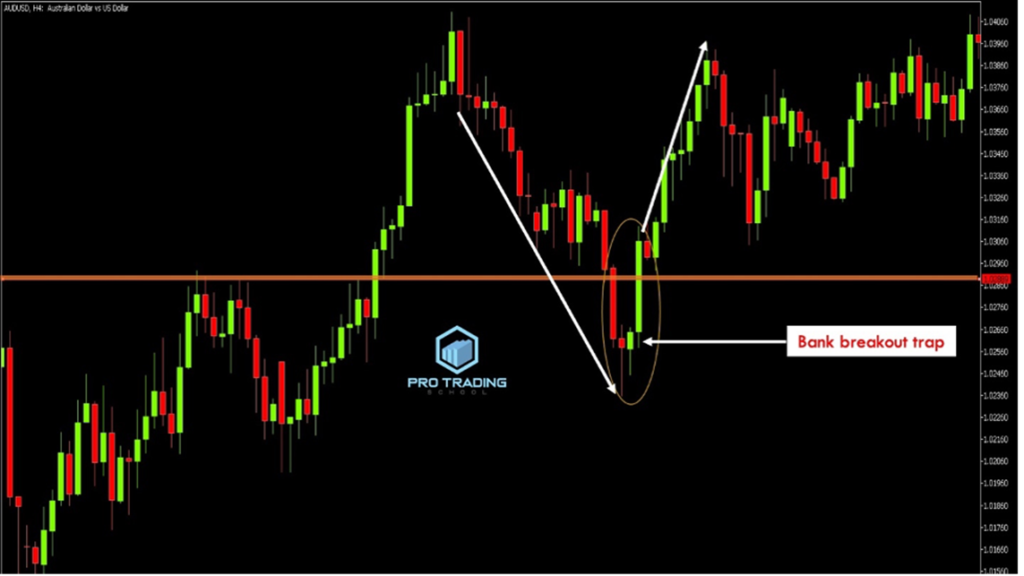
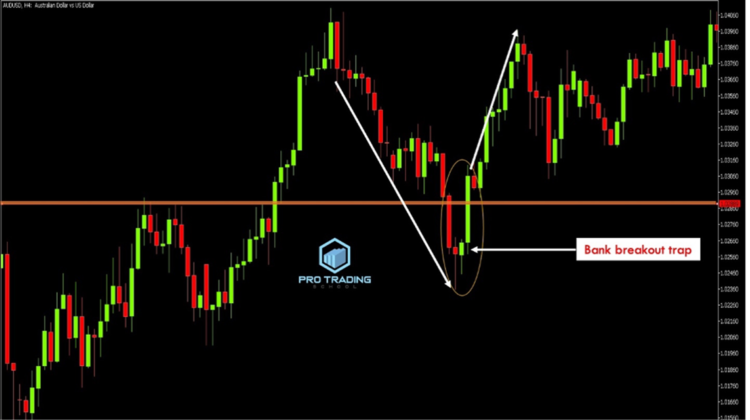
In this AUD/USD H4 chart, the market was trending up, meaning that buyers were dominating the market. When the market broke the resistance level, that level became a support level. However, when the market retraced to test it, it broke below the support level.
This created the impression that the market would continue downward, but after the close of the red candle below the support level, buyers pushed the market higher again, trapping sellers in a bank breakout trap.
Bank breakout traps occur frequently in the market, both in ranging and trending markets. If you’ve experienced this situation a few times and haven’t understood why, you’re fortunate to have found this course. Now, you’ll learn how banks take money from you and how to identify bank breakout trap patterns so you can exploit them instead of being a victim.
Trading the bank breakout trap is straightforward. It doesn’t require extensive knowledge, and the rules are simple enough for even beginner traders. The reward-to-risk ratio is impressive; you can risk 20 pips to potentially gain more than 200 pips.

