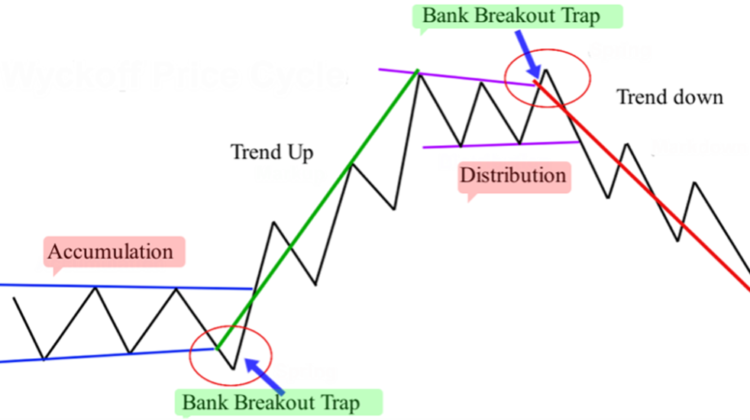
The Wyckoff Price Cycle Theory
As a trader, it’s essential to familiarize yourself with one of the most prominent theories in technical analysis—the Wyckoff Price Cycle Theory. Understanding this type of market analysis can enhance your ability to recognize how banks set traps and why such traps are created in the market.
I’m not going to delve deeply into the theory, as it’s not necessary to know every detail. Instead, it’s crucial to grasp the key part that helps you accurately identify bank breakout traps.
Richard Wyckoff, a well-known stock trader and investor born in the late 19th century, developed this theory. His price action market theory remains a foundational concept in today’s trading practices. It is widely utilized by banks, financial institutions, and many successful professional traders, including notable figures like Jesse Livermore and James Keene.
The Wyckoff theory suggests that the price cycle of any traded instrument goes through four phases. See the illustration below:
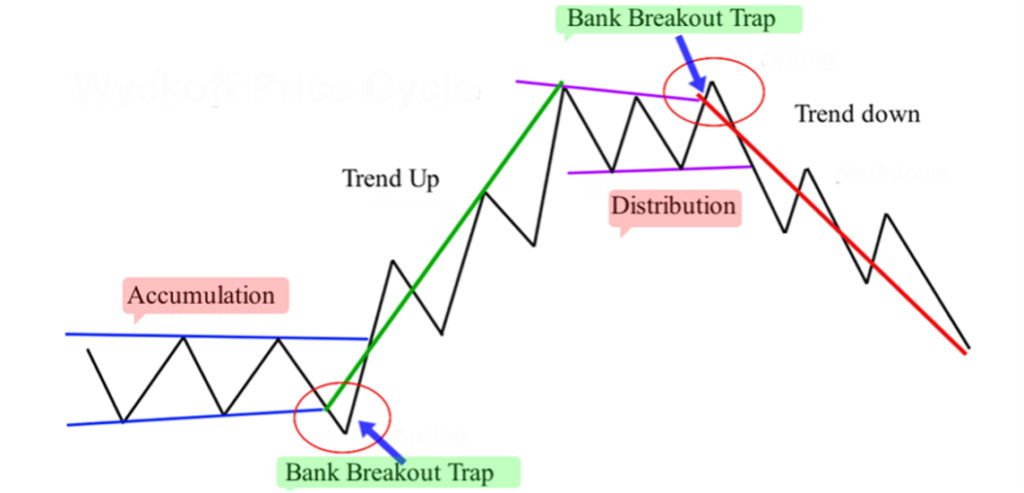
The Accumulation Phase: This is the stage where the market enters a ranging period. During this phase, banks and institutional traders accumulate long positions, aiming to push the market higher once they have accumulated enough. To fill their positions, they often set traps to entice retail traders to enter the market on the short side by inducing a downward breakout from the range. As retail traders take short positions, banks fill their buy orders and subsequently drive the price upwards, as initially intended. The illustration above shows a downward breakout trap during the accumulation phase, followed by a strong upward move.
The Trend Up: This is the second stage of the Wyckoff cycle. After trapping retail traders on the short side and filling their long positions, banks push the price above the upper range, moving the market out of consolidation and into an upward trend.
The Distribution Phase: This phase, the third in the Wyckoff cycle, is when banks begin to exit the long positions they accumulated during the earlier phases. However, unlike retail traders, banks do not exit all at once. They have substantial capital in the market and various orders, including stop losses, so exiting all at once would trigger a significant price decline, potentially affecting their own profits. Therefore, they exit gradually, causing the market to enter a ranging period once again.
The Trend Down: This is the final stage of the Wyckoff theory. As banks (buyers) start to take profits, other banks set traps to lure more buyers into the market to fill their short positions. Once enough short positions have been established, the price breaks below the lower range and moves downward.
To better understand how the market moves according to the Wyckoff Price Cycle Theory, let’s examine a real chart example below:
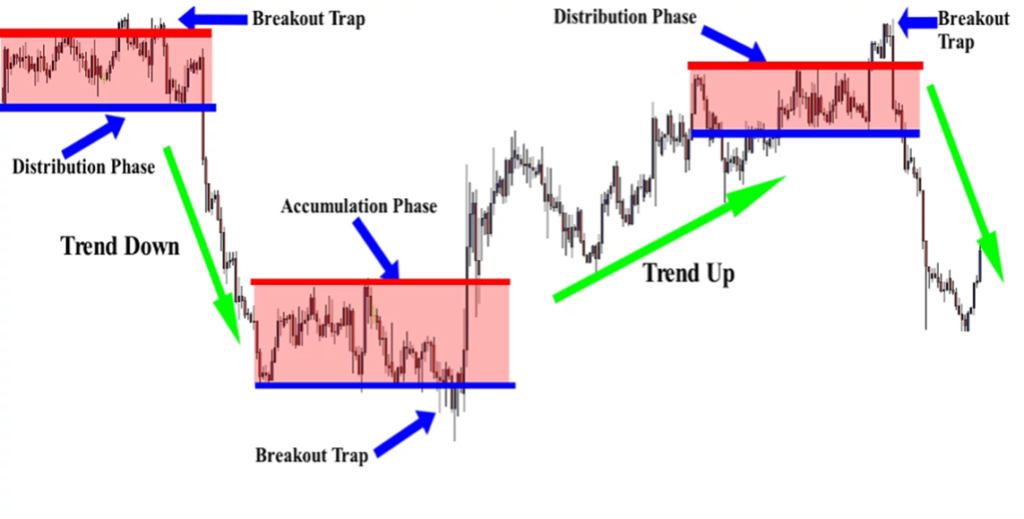
In the USD/CHF chart above, the market follows the Wyckoff price cycle. Financial institutions and banks use this theory to predict future price movements. For instance, the end of the distribution phase in the chart signals the start of a downtrend, which could be an opportunity to trade short. Conversely, the end of the accumulation phase marks the beginning of an uptrend, suitable for long trades.
However, as retail traders, we won’t trade solely based on the Wyckoff theory because we aren’t banks or hedge funds. We lack the insight to know when banks will adhere to the Wyckoff theory and when they won’t. Retail traders cannot precisely identify when the accumulation or distribution phase ends. Still, understanding this price cycle theory is valuable for comprehending market behavior.
As retail traders, our job is to follow the footsteps of banks and financial institutions by identifying their traps and anticipating major moves. Most traps occur during the accumulation or distribution phases—when the market is ranging. But these traps can also happen during both the trend up and trend down phases.
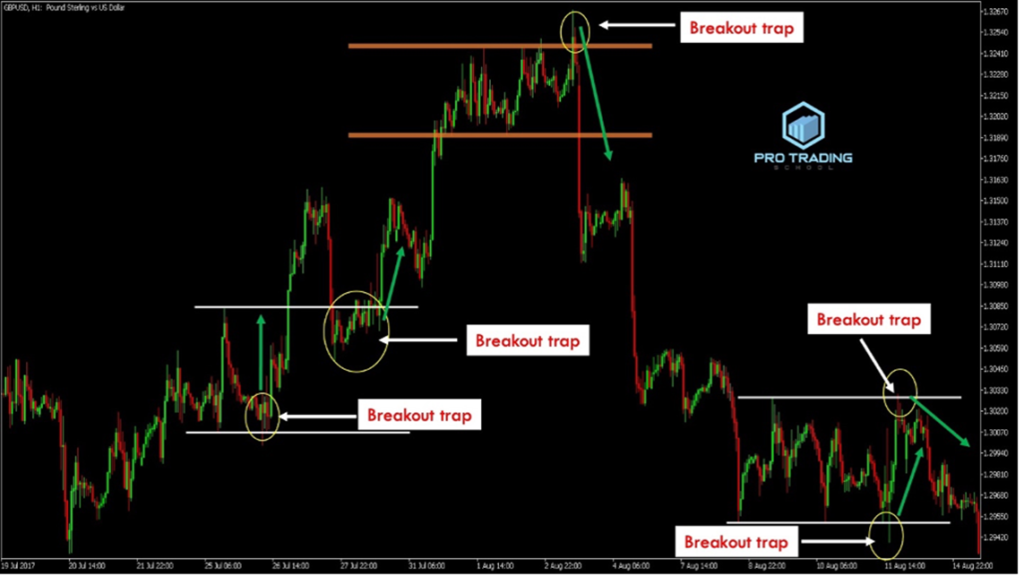
For example, in the GBP/USD H1 chart above, the market was trending up. During this upward trend, the market created traps that we can identify as high-probability setups for entering trades. The chart shows two distinct traps during this phase. Once the uptrend concludes, the market enters a range (distribution phase), where prices fluctuate between horizontal support and resistance levels. As seen in the chart, a clear breakout trap forms at the resistance level before a strong downward move.
After the downtrend finishes, the market ranges again (accumulation phase). In this phase, two traps formed at both the support and resistance levels, offering potential trade opportunities.
When analyzing charts, don’t focus solely on market phases or question whether it’s a distribution or accumulation phase. What matters is recognizing the market structure. If prices move horizontally between support and resistance, the market is ranging, and you should be alert for traps at these key levels. If the market is trending up, seek traps aligned with the uptrend. Likewise, if the market is trending down, look for traps consistent with the downtrend.
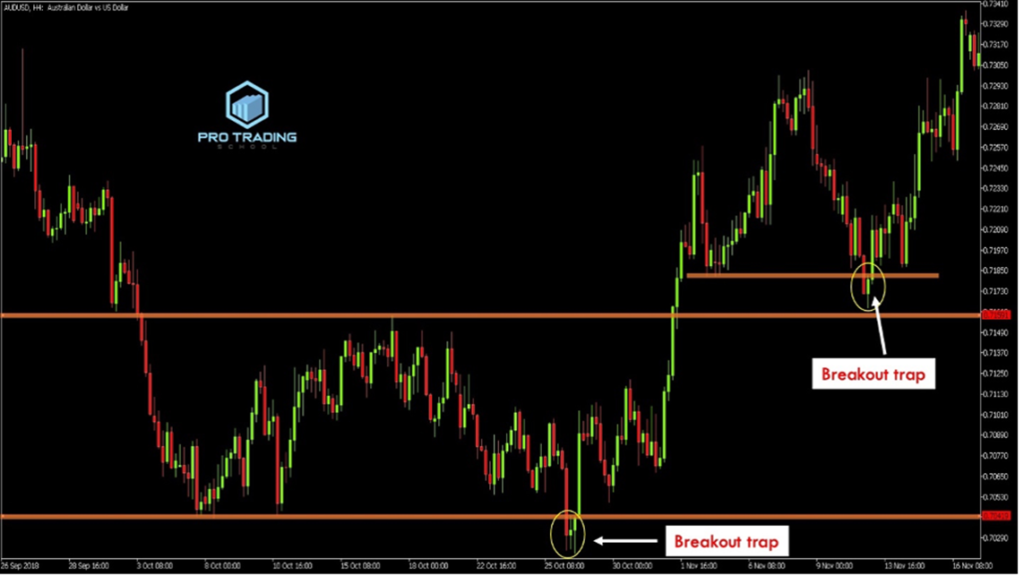
In the AUD/USD H4 chart example, the market was trending down before entering a range. A bank breakout trap occurred at the support level—a high-probability setup to enter the market. After the breakout from the range, the market trended upward and formed another breakout trap at the next support level, in line with the uptrend—another opportunity to capitalize on.
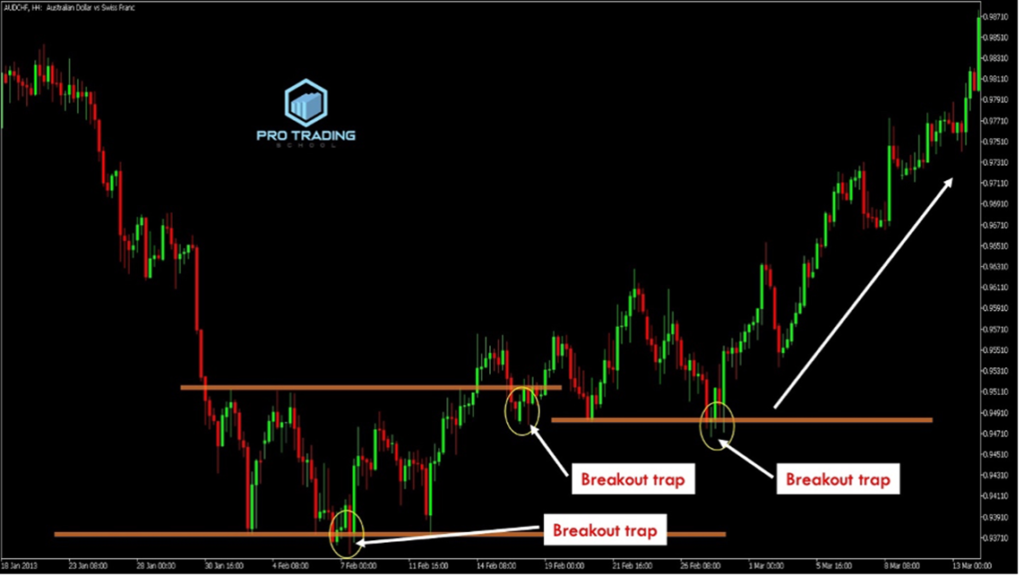
In another example from the AUD/CHF H4 chart, the market trended downward before ranging. A bank breakout pattern formed at the support level, signaling a good entry point. After the market broke above the resistance level, it retraced and briefly broke below the support (previously resistance). This downward breakout was a trap. A final breakout trap at a new support level provided an opportunity to place a buy order.
Now, you should have a clearer understanding of how the market moves according to the Wyckoff theory and how to identify high-probability setups based on bank breakout traps.

