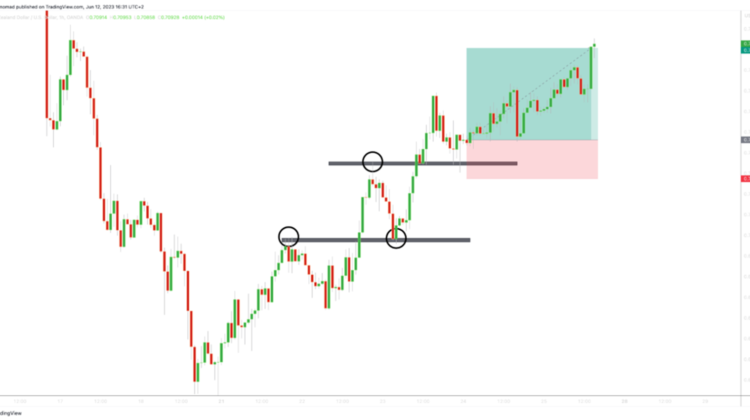
How to Trade Confluence
In this blog post, we will explore an essential yet often overlooked aspect of trading: trading with confluence. Mastering this concept can have a significant impact on your trading account. By effectively utilizing confluence, you can steer clear of low-probability trades that often result in losses. Instead, your trading decisions will be grounded in solid reasoning, distinguishing you as a successful trader.
So, what exactly is trading with confluence? Trading with confluence involves using multiple market signals to make well-informed trading decisions. Instead of relying on just a single candlestick pattern, chart pattern, or indicator signal, confluence trading takes various factors into account.
To illustrate this concept, let’s consider the example of a double top chart pattern. As a price action trader, it’s important to have a basic understanding of double tops and double bottoms. If you’re not familiar with these patterns, I strongly recommend reading my detailed blog post on the topic.
A double top pattern signals a potential trend reversal. It forms when the market fails to break above a resistance level on two consecutive attempts, indicating a possible shift in control from buyers to sellers. Take a look at the chart below:

In the chart, you can observe that the market was in an uptrend, driven by strong buying pressure, with buyers clearly in control. However, their inability to break through the resistance level suggests a potential shift in momentum. Yet, this observation by itself isn’t conclusive. There’s always the possibility that buyers could make a third attempt to breach the resistance level.
To confirm the double top formation, it’s crucial to consider additional confluence factors. Take a look at the chart below:

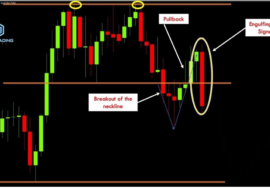
In this chart, you can see that the neckline of the double top pattern has been broken. The neckline acts as a support level, and the inability of buyers to break the resistance, combined with sellers driving the market below this support level, solidifies the confirmation of a double top formation. This breakdown indicates a potential trend reversal. However, before making a trading decision to buy into the market, it’s important to consider additional factors of confluence.
How To Use The Relative Strength Index As A factor Of Confluence ?
Let’s examine the RSI indicator to gain further insights into the market.
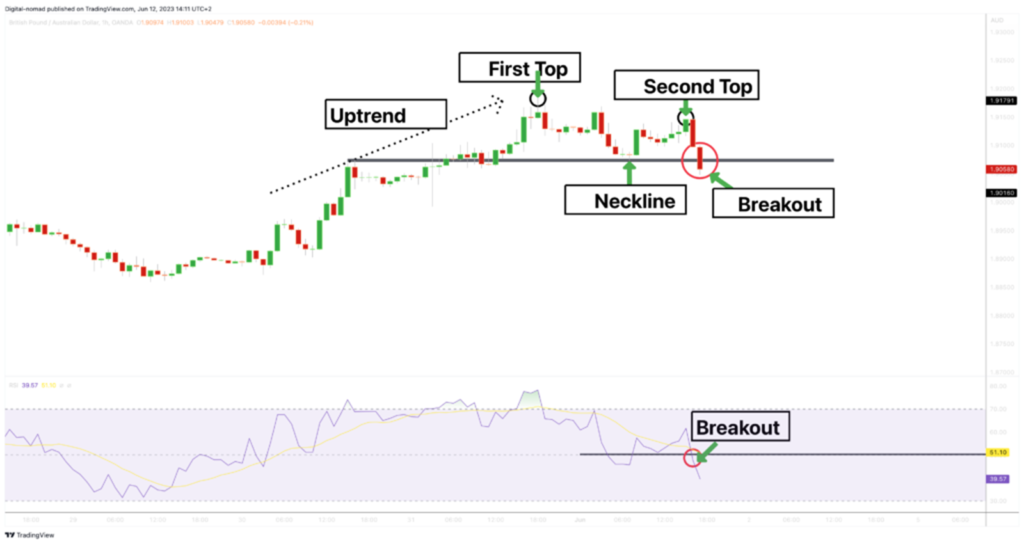
As shown in the chart, the RSI has dropped below the 50 level, signaling a downtrend. This further aligns with our analysis and strengthens our confluence.
Now, we have three factors of confluence supporting a sell order:
- The double top pattern indicates that buyers have failed to sustain the upward momentum.
- The neckline breakout confirms that sellers are pushing to reverse the market downward.
- The RSI indicator suggests a downtrend.
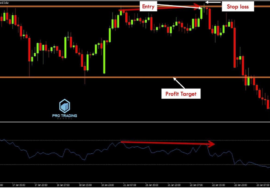
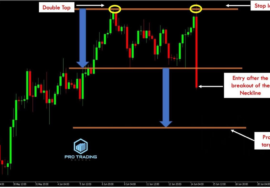
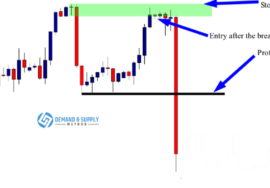
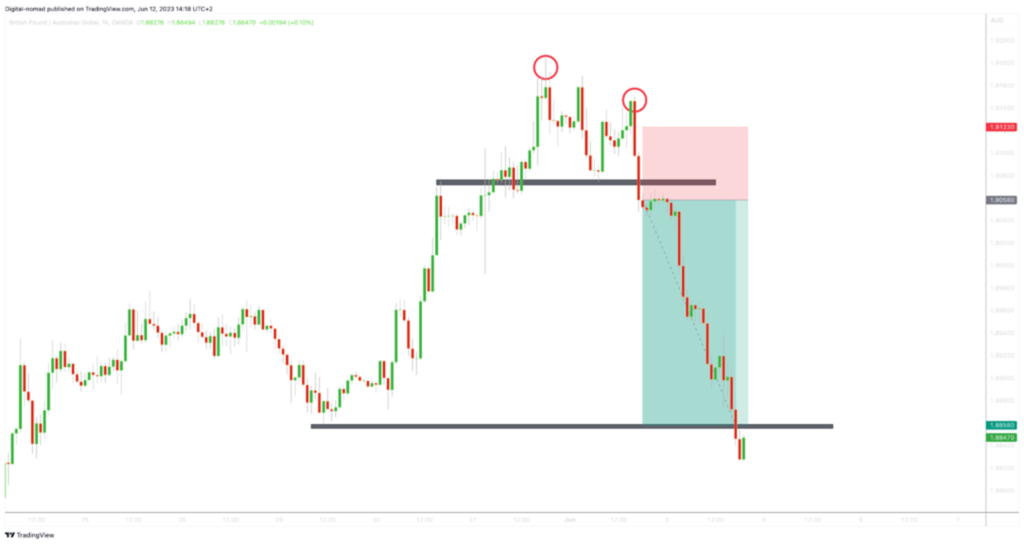
To execute this trade, place an entry order at the close of the candle that confirms the breakout, and set your stop loss just above this candle. For added safety, you can position the stop loss around 10 pips above the breakout candle. Set your target profit at the next support level. That’s all there is to it, and with a bit of luck, the market will move in your favor.
Take a look at the chart below:
How To Trade Head And Shoulders Chart Pattern With Confluence ?
Now, let’s dive into another example that emphasizes the importance of confluence in trading. Have a look at the chart below:
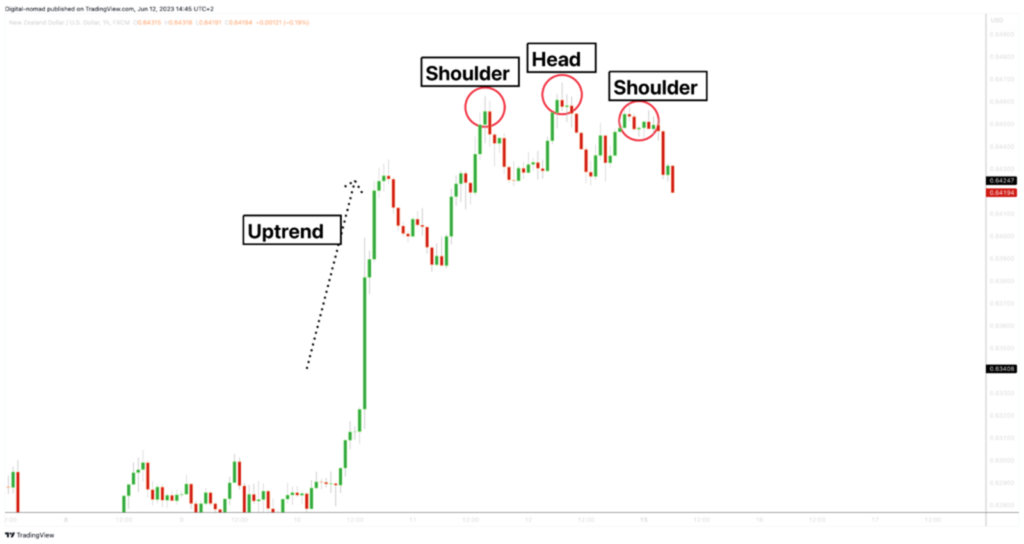
In this chart, you can observe that the market was in an uptrend, forming a well-defined head and shoulders pattern. If you’re not familiar with the head and shoulders pattern, don’t worry—I have a comprehensive blog post that explains it in detail, which you can check out below.
Head and shoulders pattern strategy guide
The head and shoulders pattern is a strong indicator of a potential trend reversal. When this pattern appears on a chart, it suggests that buyers are struggling to maintain the upward momentum, signaling the possibility of a reversal. However, relying solely on this pattern isn’t sufficient. We need additional confluence factors to strengthen our confidence in this trade setup.
The first factor of confluence we can consider is the breakout of the trend line. Take a look at the chart below:
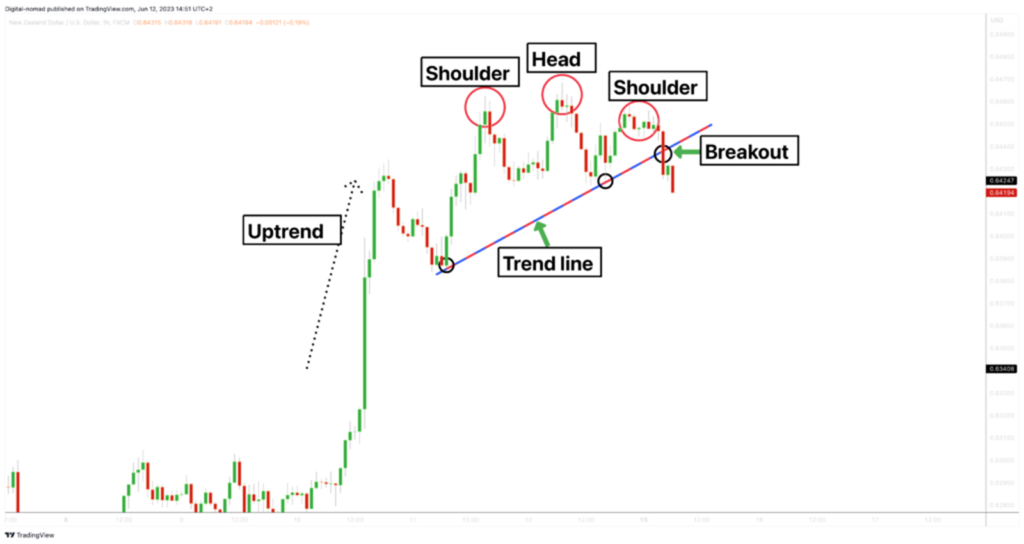
As shown in the chart, the market formed a clear trend line, which was eventually broken, signaling a potential trend reversal. It’s important to note that the breakout was strong, indicating significant selling pressure behind this move.
The second factor of confluence is the breakout of the support level, often referred to as the neckline. This breakout signifies that sellers have gained the upper hand, increasing the likelihood of the market moving downward.
Is this enough to enter the market? Yes, it is. However, to further enhance our confidence, let’s look for additional confluence factors.
We’ll use the RSI indicator to identify more signals of confluence. Take a look at the chart below:
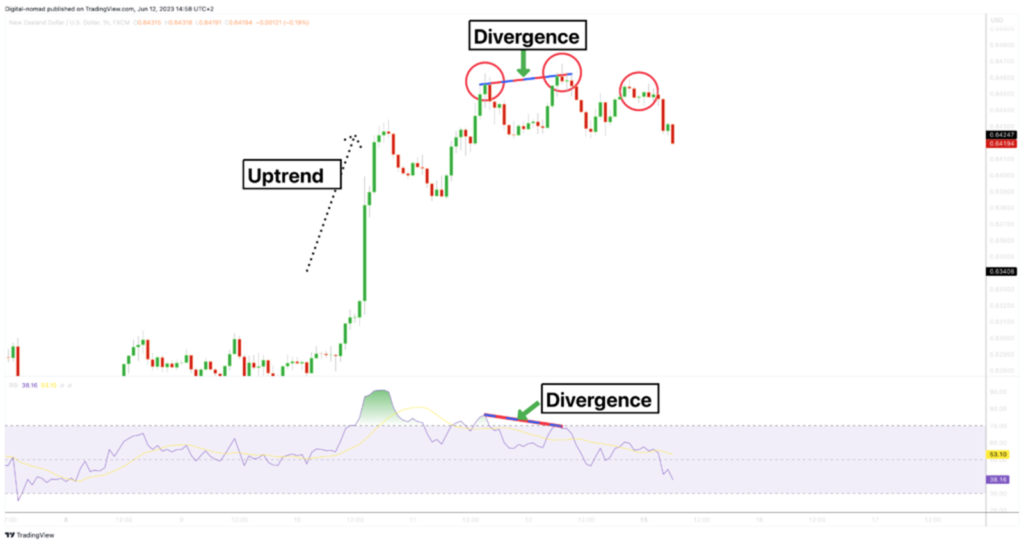
In this chart, you can see a clear divergence between the price and the RSI. While the price was moving upward, the RSI was trending downward. This divergence adds another layer of confluence to support our trading decision.
Additionally, the breakout below the 50 RSI level confirms that the market is already in a downtrend, further reinforcing our case for entering this trade.
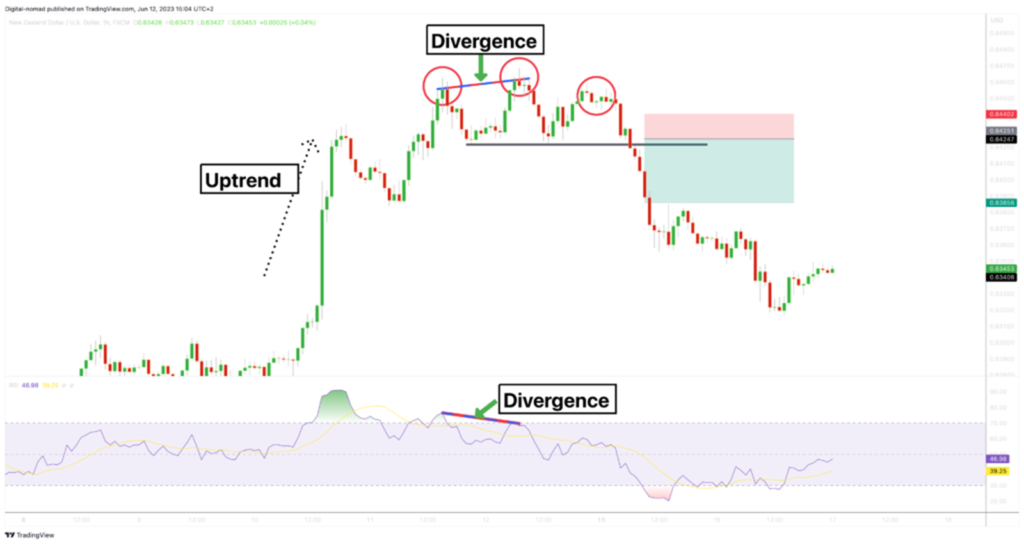
Considering all these factors, we now have multiple reasons to justify entering the market. To execute this trade, place an entry order at the candle that broke below the neckline, and set your stop loss just above this level. For your target, aim for the next support level. Take a look at the chart below:
Using Fibonacci Retracement Levels as a Factor Of Confluence
Let’s explore the final example, which clearly demonstrates how trading with confluence can significantly improve your trading performance. Take a close look at the chart example below:
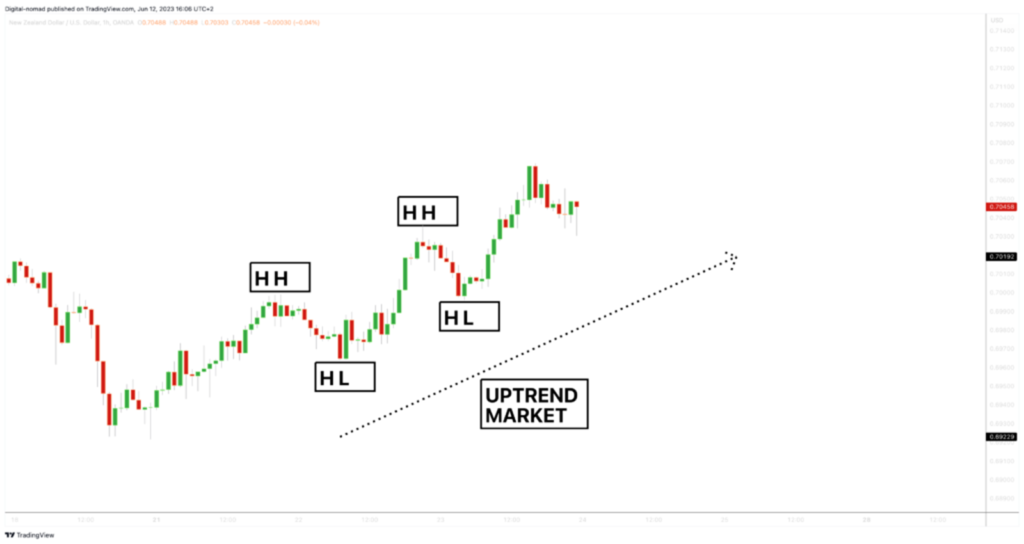
In this chart, you’ll notice a strong upward trend characterized by higher highs and higher lows. As a price action trader, it’s crucial to recognize this robust uptrend and focus on trading in the direction of the trend, rather than trying to anticipate reversals. Our goal is to join this upward momentum and capitalize on potential profits.
To effectively trade an uptrend, it’s essential to understand the pattern it follows. Let me provide a brief explanation.
An uptrend typically consists of two key moves: an impulsive move that aligns with the trend, and a retracement move that temporarily goes against the trend. As a trader, your objective is to identify the beginning of the impulsive move so you can align with the prevailing uptrend and avoid getting caught in the retracement moves.
Refer to the chart below:
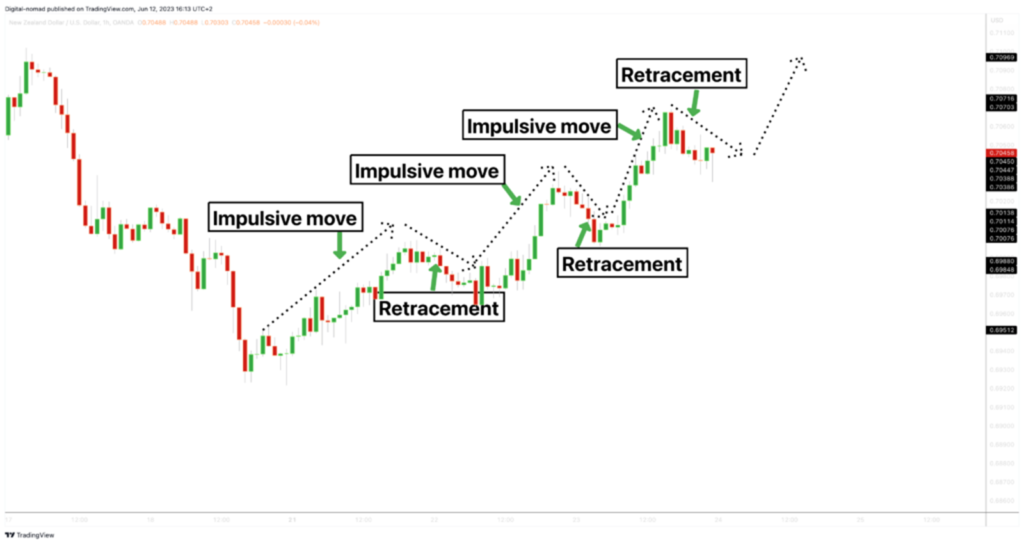
In this chart, you can clearly see the impulsive moves followed by retracement moves. These alternating phases are typical of an uptrend. During a retracement move, the price breaks through the previous resistance level, which then becomes a support level.
This support level is crucial because it indicates the potential starting point of the next impulsive move. To position ourselves for this upcoming impulsive move, we need to patiently wait for the price to reach the support level.
Take a look at the chart below:
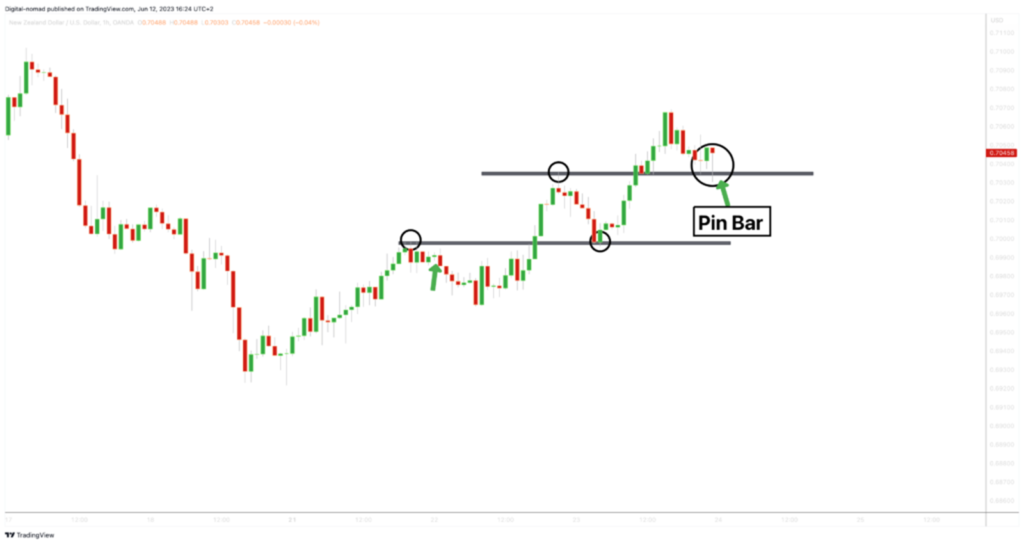
As shown in the chart, once the price reaches the support level, a clear pin bar formation emerges, signaling a strong rejection and the potential start of another impulsive move.
At this point, we have several confluence factors: an established uptrend, a significant support level, and a candlestick pattern signal. These factors already provide a solid foundation for entering a trade. However, we can further enhance our confidence by adding another layer of confluence.
Let’s consider incorporating the Fibonacci retracement as an additional factor. Examine the chart below:
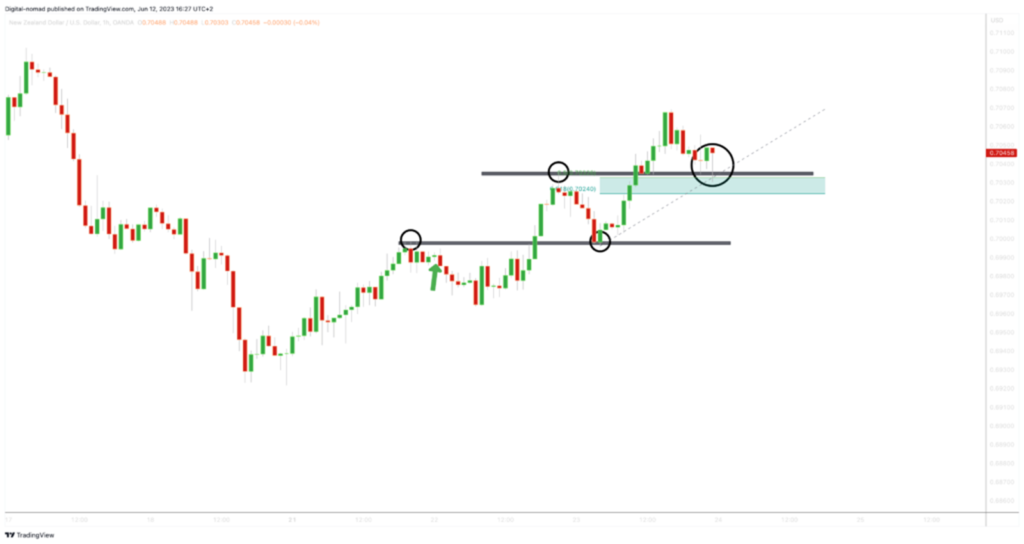
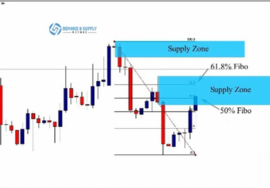
By applying the Fibonacci retracement tool, we can see that the pin bar was rejected not only from the support level but also from the 61.8% and 50% Fibonacci retracement areas. These levels are highly significant and closely watched by successful traders.
The presence of this confluence factor helps to validate our trading decision. With all these factors combined, we are now well-positioned to enter the market with confidence. Refer to the chart below:
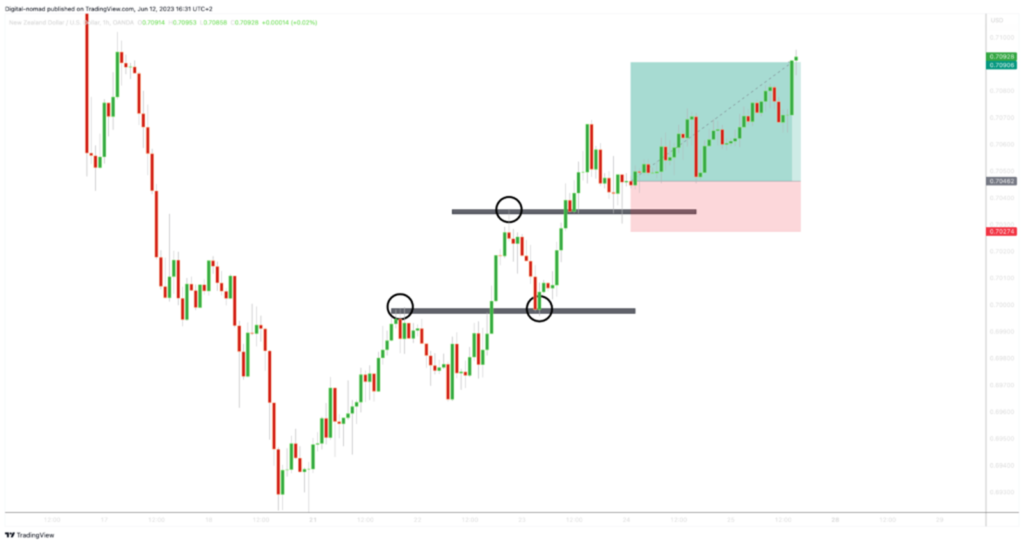
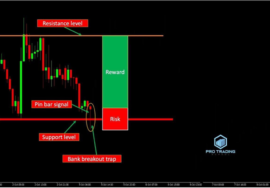
As shown in the chart, we place our entry order at the close of the pin bar and set our stop loss 10 pips below the wick. For the profit target, we aim for the next significant level. Following these steps, the market often aligns in our favor, presenting profitable opportunities.
Conclusion
By harnessing the power of confluence, you greatly enhance your chances of successful trades. This approach enables you to identify high-quality trading opportunities and build confidence in your decision-making process. Incorporating the concept of confluence into your trading strategy can elevate your potential for achieving exceptional trading results.

